The Indian equity markets went on to end their fourth week in a row with gains as the NIFTY extended its up move. However, unlike the previous week, the trading range narrowed down considerably and momentum appeared to be losing its strength as well. As compared to the 400-point trading range seen in the week before this one, the NIFTY oscillated this time in a much narrower 171-point range. After moving in this contracted trading range, the headline index managed to end with a net weekly gain of 160.70 points (+1.51%).
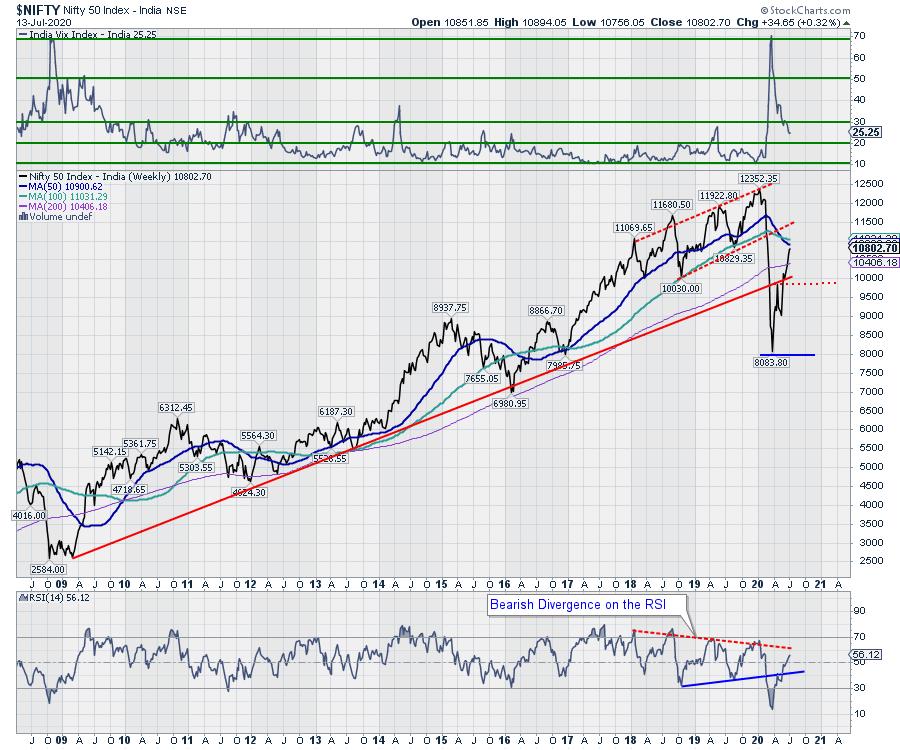
Although the Index has managed to push itself higher in the risk-on environment fueled by the massive liquidity gush, the markets in general appear to be losing momentum and showing signs of fatigue at current levels. The India Volatility Index, INDIAVIX, declined by 3.20% to 24.94 while staying at one of its lowest levels in recent times. The NIFTY has managed to move past its 200-week MA, which presently stands at 10395; it is showing enough signs that the present rally may take a breather and the markets will consolidate at current levels.
The week is expected to see a tentative start with the levels of 10904 and 11000 acting as stiff resistance points. The supports come in much lower at 10635-10570 levels.
The weekly RSI stands at 55.75; it has marked a fresh 14-period high, which is bullish. RSI, however, does not show any divergence and remains neutral against the price. The weekly MACD is bullish as it trades above its signal line. A spinning top emerged on the candles. This formation on the candles shows diminishing momentum and lack of consensus among the market participants. If the spinning top emerged after a strong rally, it has a potential to stall the present trend, at least temporarily.
The pattern analysis shows that the NIFTY has managed to move past the 200-WMA and stay above that level on a closing basis. However, the 50-week MA has crossed the 100-week MA from above, indicating a likely onset of some intermediate weakness. The 50-Week MA is 10904 while the 100-Week MA presently stands at 11037.
Overall, the markets are showing clear signs of fatigue and it would be no surprise if the NIFTY sees some consolidation or measured corrective activity over the coming days. If the NIFTY makes relentless up moves, the risk-reward ratio will get more unfavorable for the retail investors and traders while chasing the upside momentum. We emphasize the need for protection of profits at higher levels and recommend using all future up moves more to protect profits moreso than for making new purchases. A defensive and stock-specific approach is advised for the coming week.
Sector Analysis for the Coming Week
In our look at Relative Rotation Graphs®, we compared various sectors against CNX500 (NIFTY 500 Index), which represents over 95% of the free float market cap of all the stocks listed.


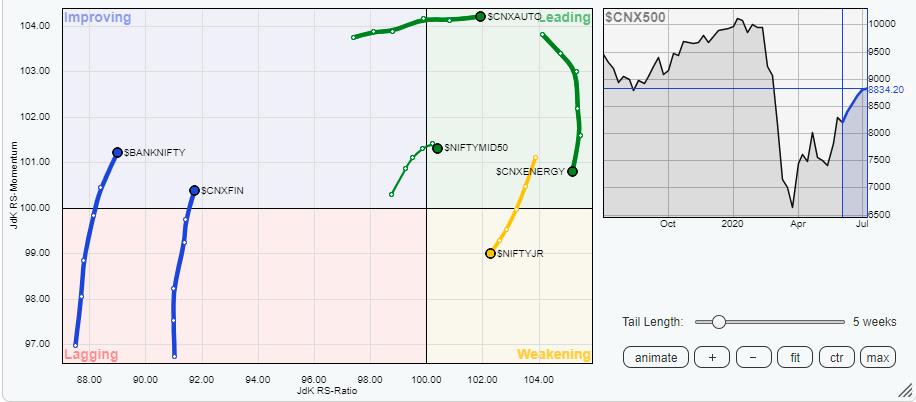
Our review of Relative Rotation Graphs (RRG) shows nothing much has changed on the sectors' placements on the charts. With the markets trading in a narrow range, these sectors too have moved, albeit very little, on their expected trajectory. The Auto Sector is the only sector in the leading quadrant which looks comfortably placed. This group is set to relatively outperform the broader NIFTY 500 Index.
The Infrastructure, Energy and Commodities groups are also placed in the leading quadrant. However, they appear to be drifting lower while giving up on their relative momentum; they are rotating and moving towards the weakening quadrant. However, some stock-specific outperformance among these groups cannot be ruled out.
The FMCG, Consumption and the IT Indexes are in the weakening quadrant; they continue to negatively rotate in the southwest direction and appear to be moving towards the lagging quadrant. These groups have topped out and are set to relatively underperform the broader markets.
BankNifty has advanced in the improving quadrant. Hopefully, its period of underperformance of the immediate short-term has ended. It is likely to stay resilient going ahead on a relative basis. Nifty Services remains in the lagging quadrant, but it is seen sharply improving on its relative momentum. Realty and PSU Banks are placed comfortably in the improving quadrant along with Media and Metal groups.
Important Note: RRG™ charts show the relative strength and momentum for a group of stocks. In the above chart, they show relative performance against NIFTY500 Index (Broader Markets) and should not be used directly as buy or sell signals.
Milan Vaishnav, CMT, MSTA
Consulting Technical Analyst


