After being heavily spooked by rising bond yields and strengthening the US dollar in consequence, the Indian equity markets remained weak throughout the week, barring the last day where it saw some technical rebound from the short-term oversold levels. The NIFTY moved in a wide 700-point range and, if looked at on the weekly timeframe charts, continued to stay in a broad consolidation range. Though the Index still hasn't hit the key levels on the higher timeframe charts, it has violated a few important levels on the daily chart. After suffering a negative close on four out of the past five days of the week, the headline index showed a 400-point rebound from the lows of the previous session, ending with a net loss of 286.95 points (-1.91%) on a weekly note.
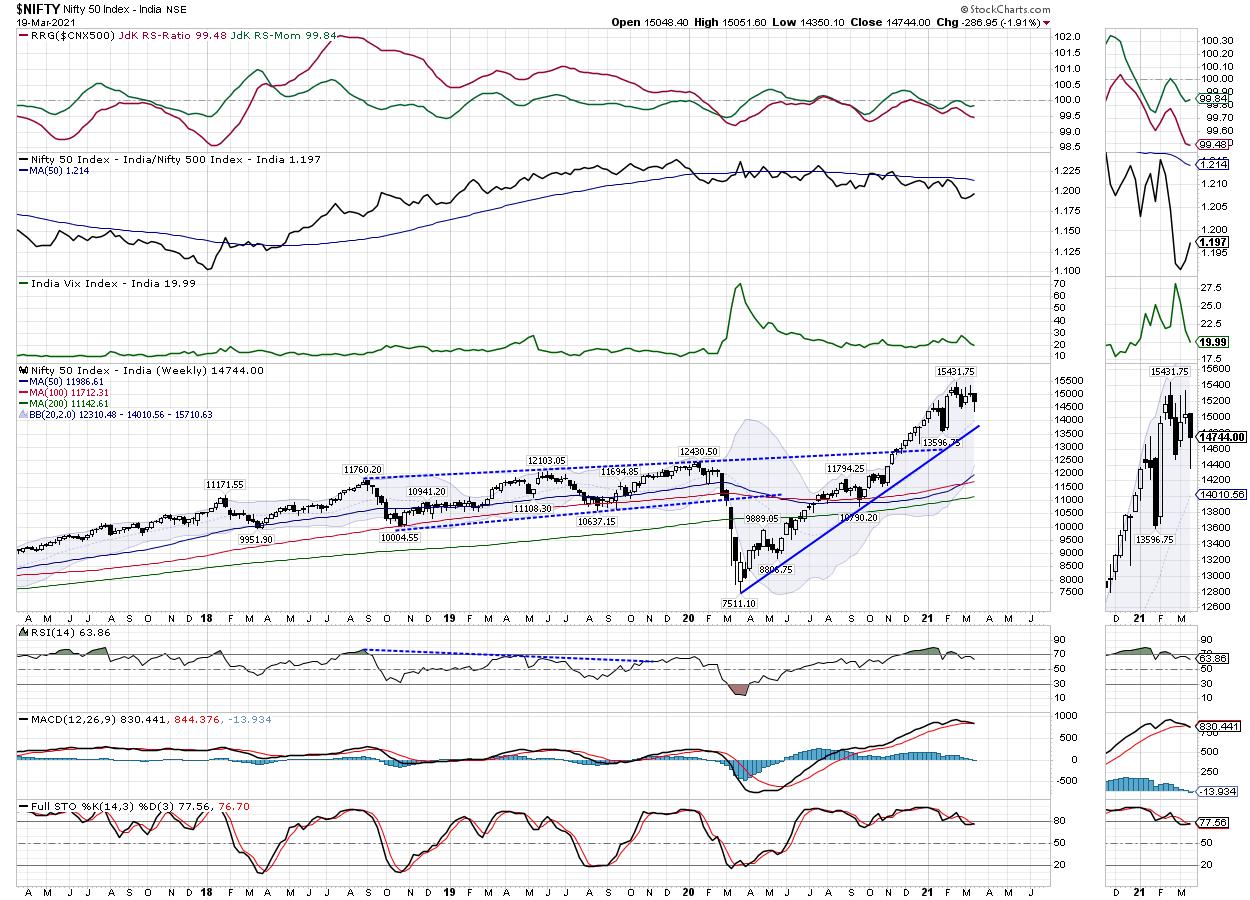
The 10-Year US Bond yields, which have now moved past 1.70, will continue to haunt the equity markets over the coming days. The Indian markets in particular, which were oversold on short-term charts, saw a strong technical rebound on the last trading day of the week. This rebound may well become extended as we enter the expiry week of the current derivative series. That being said, even if we look at the domestic charts in isolation, it clearly shows that the NIFTY has slipped into a broad-ranged consolidation, and has also dragged its supports much lower, near 15000-15100 levels for the near term.
Another relation that remains disturbed is the usually inverse relation that the Volatility Index (INDIAVIX) shares with NIFTY. Along with the markets, the INDIAVIX has also come off by another 7.92% to 19.99. In the week before this one, the INDIAVIX had come off by 15.07%. This inverse relation may get corrected; we may see the Index extending the technical pullback to a limited extent and can also expect volatility to increase over the coming days.
The coming week will see the levels of 14865 and 15000 acting as resistance points. The supports come in lower, at the 14500 and 14380 levels.
The weekly RSI is at 63.86; it remains neutral and does not show any divergence against the price. The weekly MACD had a negative crossover; it is now bearish and below its signal line. A black body with a long lower shadow occurred. The bottom of this candle can be relied upon as temporary support for the Index.
The pattern analysis indicates that NIFTY has been trapped in a broad-ranged consolidation. Although it tested and violated a few key levels on the daily charts, it is still 730-odd points away from the faster 20-week MA, which presently stands at 14010 and tracks the rising trend line seen on the chart. The Bollinger Bands, which had become wider than usual, are seen beginning to contract; this indicates that the NIFTY may well stay in a broad range for a while and may not show any runaway up move.
The defensive play has become quite evident in the markets. Select Auto stocks are seeing some relative strength but, apart from that, the Energy, FMCG, Consumption, and very select Pharma stocks have started to show improvement in the relative performance. This trend is likely to work out in the coming week as well. The NIFTY may well see the technical rebound getting extended, but it is likely to say limited in its extent. We recommend avoiding shorts, staying highly stock-specific and keeping exposures at modest levels throughout the coming week.
Sector Analysis for the Coming Week
In our look at Relative Rotation Graphs®, we compared various sectors against CNX500 (NIFTY 500 Index), which represents over 95% of the free float market cap of all the stocks listed.
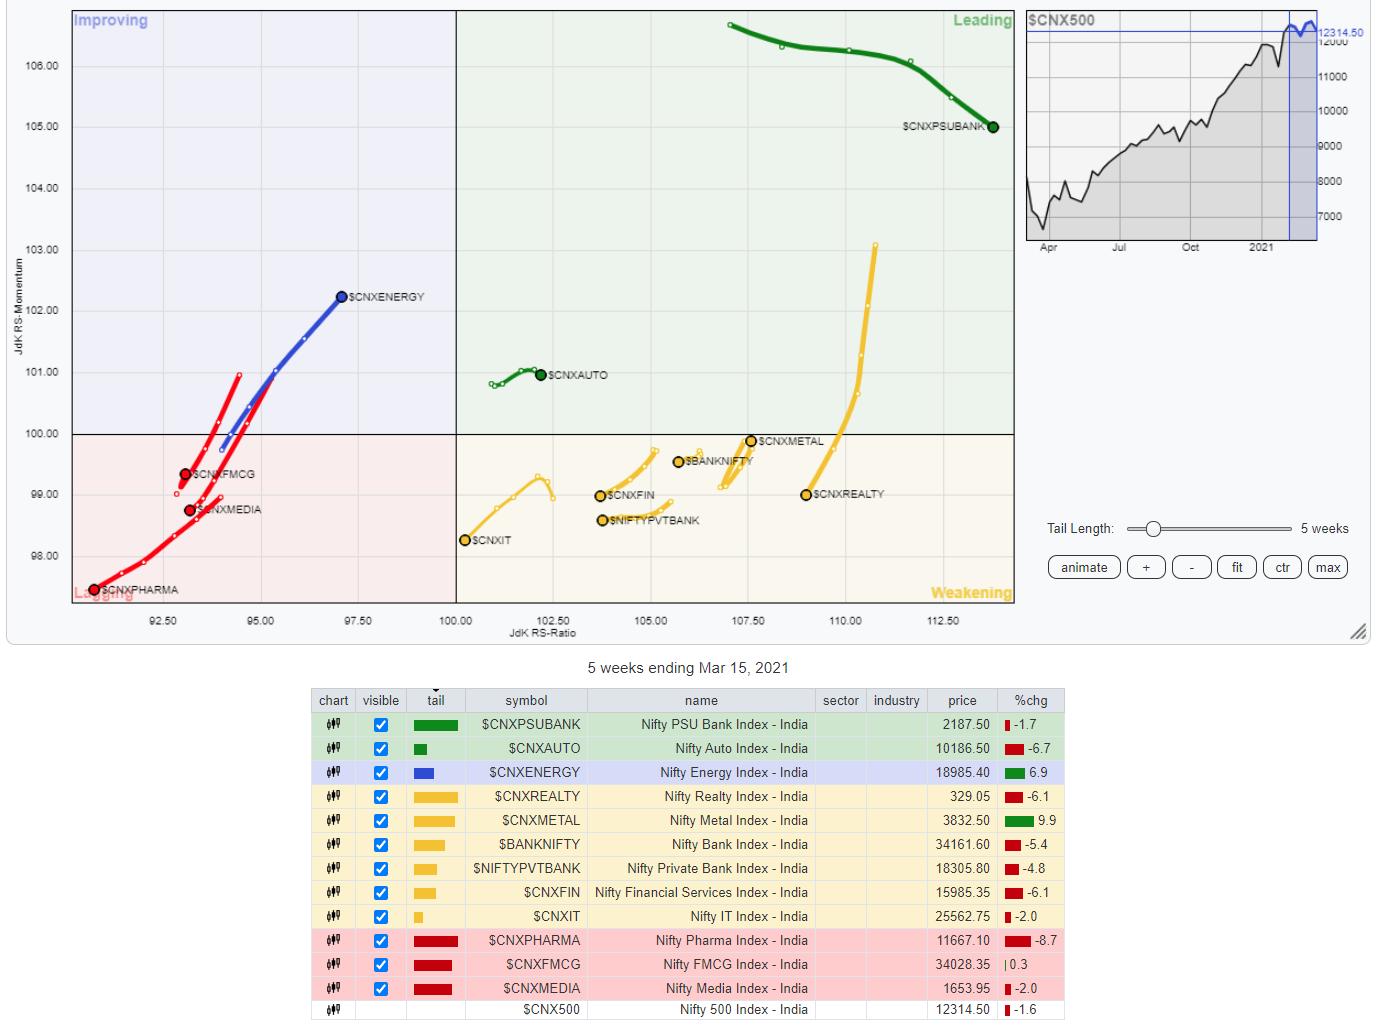
The review of Relative Rotation Graphs (RRG) shows that the NIFTY Infrastructure, PSE, Commodities, Auto and Midcap 100 Indexes are placed in the leading quadrant and appear to be maintaining their relative momentum. These groups are likely to relatively outperform the broader markets. The NIFTY PSU Banks and the Small Cap indexes are also inside the leading quadrant; however, they are seen paring their relative momentum.
The NIFTY Financial Services, IT, Realty, BankNifty and Services Sector Indexes are inside the weakening quadrant and appear to be rotating in the southwest direction. The NIFTY Metal Index is also in the weakening quadrant, but appears to be rolling back towards the leading quadrant.
The NIFTY Media, Pharma, and Consumption Index continue to languish in the lagging quadrant. They are likely to relatively underperform the broader markets.
The FMCG Index has shown a sharp improvement in its relative momentum; it appears to have changed its trajectory while being placed inside the lagging quadrant. This index, along with the Energy Index (which is inside the improving quadrant), is likely to show resilient performance over the coming days and may outperform the broader NIFTY 500 index on a stock-specific basis.
Important Note: RRG™ charts show the relative strength and momentum for a group of stocks. In the above chart, they show relative performance against NIFTY500 Index (Broader Markets) and should not be used directly as buy or sell signals.
Milan Vaishnav, CMT, MSTA
Consulting Technical Analyst,


