The week that went by remained on much of the analyzed lines. In the previous weekly note, it was mentioned that the NIFTY is unlikely to see any runaway rise as per the technical setup, as well as the Options data that point in time. It was also mentioned that the NIFTY may also have a wide-ranging five days ahead. On these expected lines, the NIFTY traded in a 490.60-point range and stayed largely in the corrective mode. The index consolidated in a broad but defined range while it dragged its resistance points lower. Following a stable but corrective week, the headline index closed with a net loss of 321.15 points (-1.80%) on a weekly basis.
From a technical perspective, the NIFTY has marked the zone of 17900-17950 as an intermediate top for the markets. This is also reflected in the Options data, which continues to have the strikes of 18000 as the point which has the highest Call OI accumulation, given the heavy call-writing activities. The previous five days have also resulted in the formation of a broad trading range in the 17400-17950 area; unless the markets violate either of these two points, we will see the Index oscillating in this broad range. Any major slip below 17400 will be damaging for the markets.
Following heavy put writing at the 17400 and 17500 levels, the 17500 strikes have the highest Put OI at the present date. The coming week is likely to see the markets attempting to stabilize with a positive bias. The levels of 17650 and 17750 will act as potential resistance points; the supports will come in at the 17400 and 17310 levels.
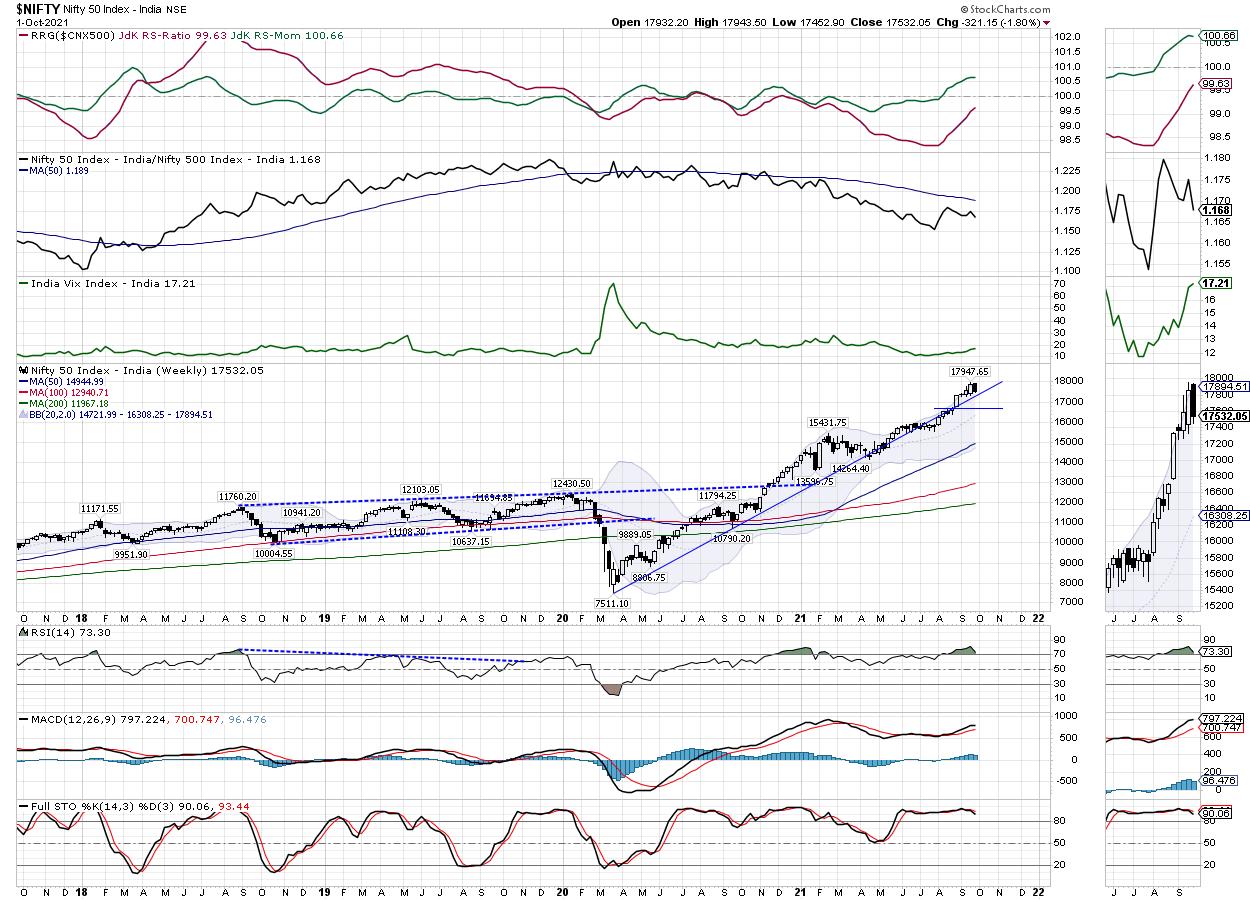
The weekly RSI is 73.30 and it remains mildly overbought. The RSI is neutral and does not show any divergence against the price. The weekly MACD is still bullish and trades above the signal line. A large black body emerged on the candles; it reflects the directional consensus of the market participants that prevailed during the week.
The pattern analysis shows that the NIFTY is well above the upper rising trend line support. In the event of continued corrective activity, and if the NIFTY tests this trend line support, it may find support in the 17350-17400 area. This trend line is drawn from the low point of March 2020; it joins the subsequent higher bottoms.
All in all, it is largely expected that, while defending the zone of 17350-17400, the markets may stay in a defined range and continue to consolidate. The most recent price action has seen the supports for the NIFTY getting dragged lower at 17800 from 17950. So 17800 will be the most immediate resistance if the NIFTY attempts to gain some stability and pull itself back. Over the coming days, we expect a selective sectoral outperformance to continue in the markets. There are higher chances that select banks, auto, pharma and PSE stocks continue to do well. It is recommended that shorts should be avoided; purchases must be kept highly stock-specific over the coming week.
Sector Analysis for the Coming Week
In our look at Relative Rotation Graphs®, we compared various sectors against CNX500 (NIFTY 500 Index), which represents over 95% of the free float market cap of all the stocks listed.

The analysis of Relative Rotation Graphs (RRG) shows a lot of inherent strength in the markets. The IT and the Realty Indexes are placed inside the leading quadrant. Apart from this, NIFTY Energy and the Banknifty have rolled inside the improving quadrant. This shows a likely end of their relative underperformance against the broader markets.
Along with this, the Media, Private Banks, PSE Index, PSU Bank Index and the Auto Index are all inside the lagging quadrant. However, all these indexes are showing a very distinct improvement in their relative momentum against the broader NIFTY500 Index. All these groups are likely to put up a very resilient show over the coming days.
The NIFTY Services Sector Index has rolled inside the improving quadrant.
The NIFTY Commodities and the Metal indexes are inside the weakening quadrant; they show no signs of any improvement in their relative momentum. Some stock-specific isolated performances may be seen, but the indexes are likely to relatively underperform the broader markets.
Important Note: RRG™ charts show the relative strength and momentum for a group of stocks. In the above chart, they show relative performance against the NIFTY 500 Index (Broader Markets) and should not be used directly as buy or sell signals.
Milan Vaishnav, CMT, MSTA
Consulting Technical Analyst
www.EquityResearch.asia | www.ChartWizard.ae
- For Premium Equity Portfolio Advisory on Indian Stocks, Click Here.
- For Alpha-generating actionable investment ideas on the US and UK Equities, Click Here.
- For International Commodities like Gold, Crude Oil, and EURUSD/GBPUSD pairs, Click Here.


