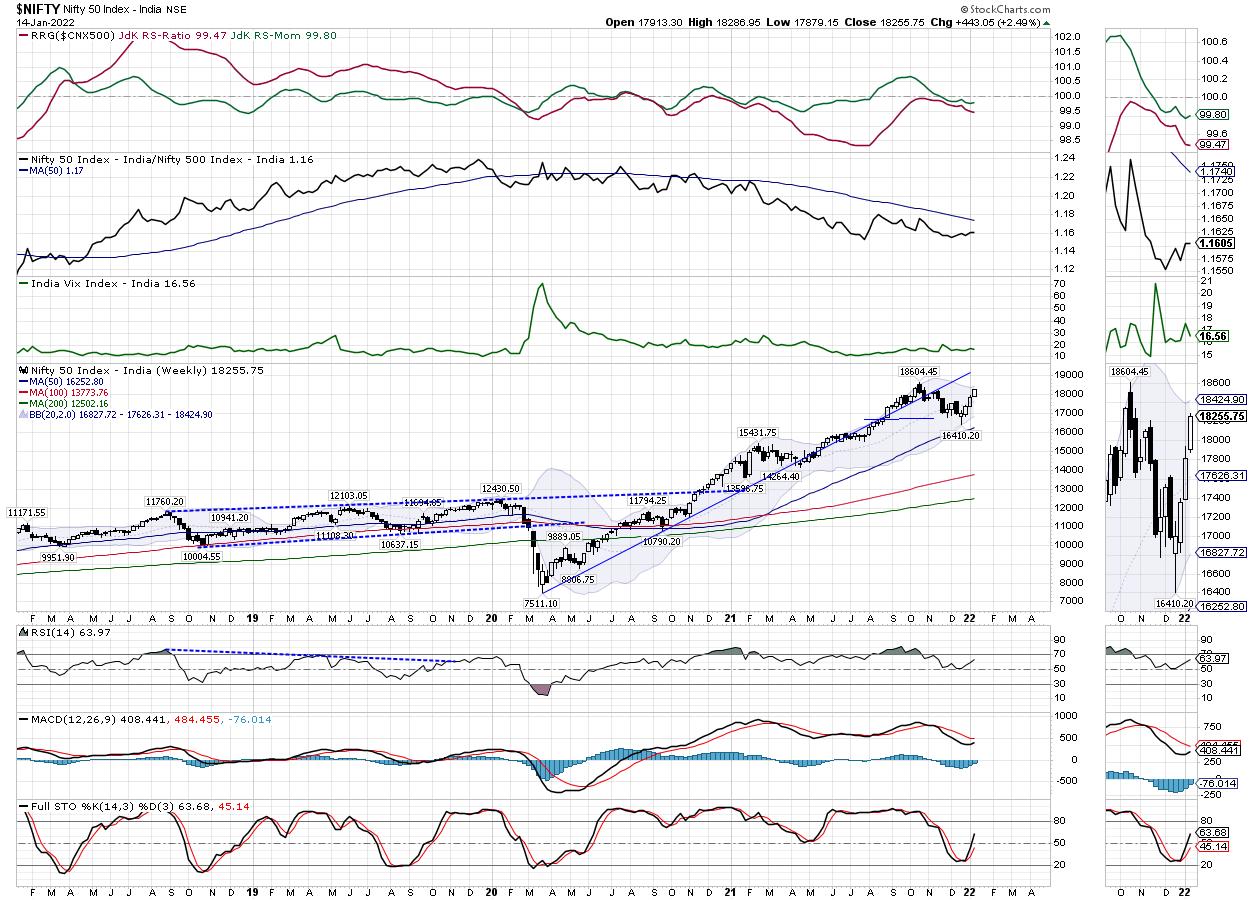
In strong but modestly-ranged sessions over the past five days, the Indian equity markets extended their up move for the fourth week in a row while posting gains. All five sessions were strong; the markets traded with a positive bias and used each of the consolidation times to just strengthen themselves and post incremental gains. The trading range stayed that of 407-odd points; the directional bias, though, remained very much unanimous. Following a strong trending move, the headline index ended with net gains of 443.05 points (+2.49%) on a weekly basis.
From the available derivatives data, the levels of 18200 remain a critical level to watch for the coming week. This level saw the highest addition of both Put and Call OI on Friday; interestingly, this level holds the highest accumulation of both Call and Put OI for the next weekly options expiry. This is obviously very much subject to change, but the direction in which it will change will decide the trend for the coming week. If the NIFTY is able to defend the levels of 18200 and keep its head above this, we may see some more incremental gains coming in. If not, then some consolidation around current levels cannot be ruled out.
Volatility dropped over the previous week. INDIAVIX came off by 5.95% to 16.56 on a weekly basis. The coming week is likely to see the levels of 18390 and 18600 acting as immediate resistance points. The supports come in at the 18050 and 17900 levels. The trading range over the coming week is likely to remain wider than usual.
The Relative Strength Index (RSI) on the daily chart is 63.94; it is neutral and does not show any divergence against the price. The weekly MACD is bearish and below the signal line. However, the narrowing histogram hints towards the likely crossover of this indicator over the coming weeks. A strong white body emerged on the candles; this showed the directional consensus of the participants on the upside.
The pattern analysis shows that the NIFTY has taken support at the extended trend line near 16400; it has validated this pattern support and has staged a remarkable technical pullback from those levels. Presently, it is above the 20-Week MA; it is also trading all its key moving averages.
From the technical perspective, the coming week looks strong; there is a greater chance that the NIFTY may continue extending its move. However, given the kind of technical pullback over the past month, there is the possibility of some consolidation as well. In any case, even if any kind of consolidation happens, the downsides would be very limited and any such consolidation is likely to remain highly defined and ranged. It is reiterated that you avoid creating shorts; all consolidation phases must be used for making quality and selective purchases.
Sector Analysis for the Coming Week
In our look at Relative Rotation Graphs®, we compared various sectors against CNX500 (NIFTY 500 Index), which represents over 95% of the free float market cap of all the stocks listed.
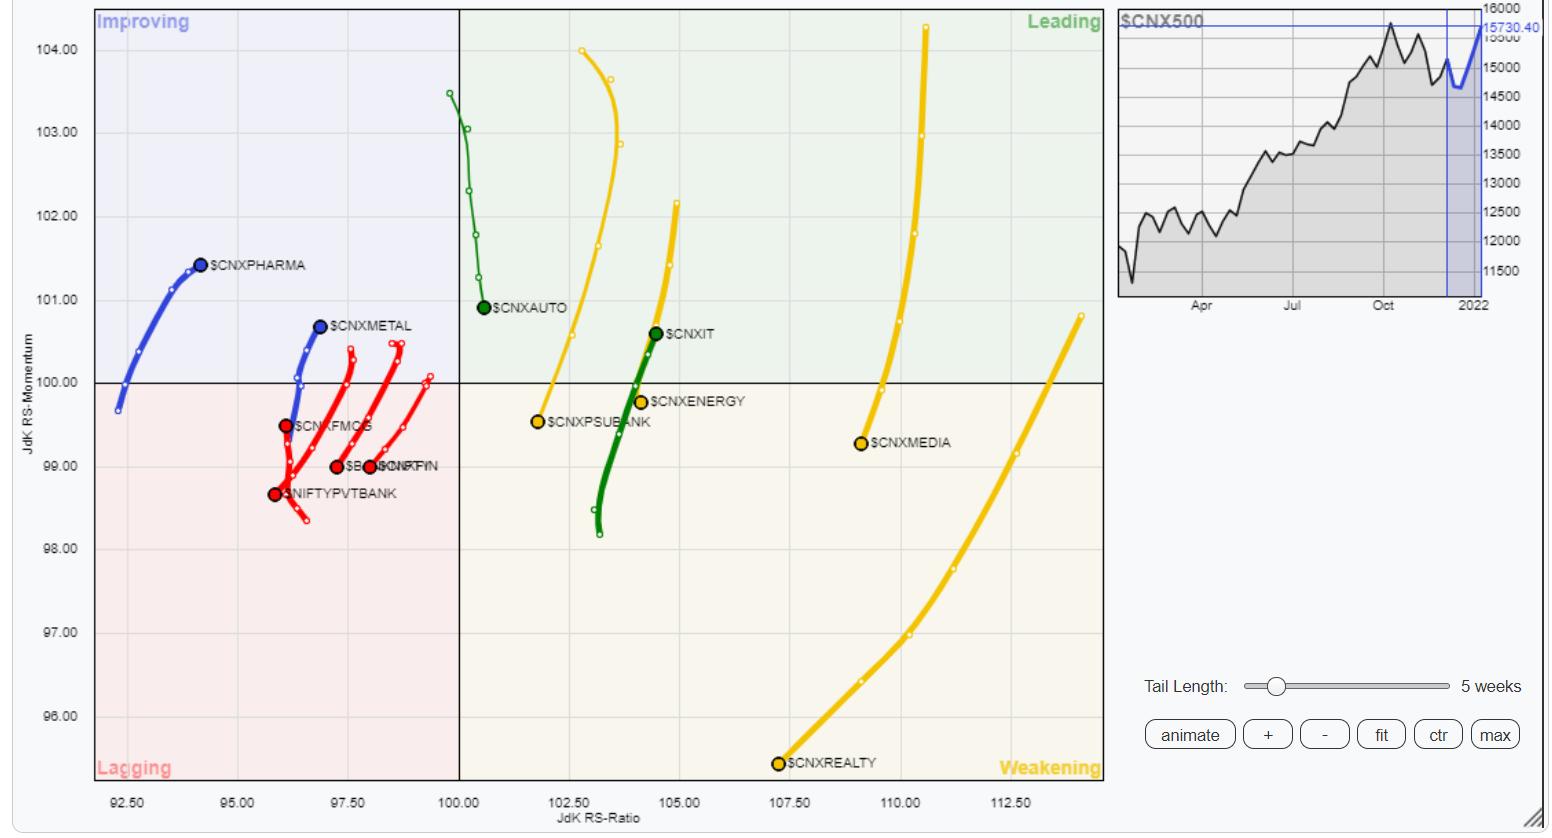
The analysis of Relative Rotation Graphs (RRG) shows the NIFTY IT Index is the only Index that is inside the leading quadrant and is also maintaining its relative momentum against the broader markets. Apart from this, NIFYT Auto is inside the leading quadrant, but looks like it is paring its relative momentum.
NIFTY Media has slipped further inside the weakening quadrant. Along with this, the PSU Bank and the Infrastructure Index are also inside the weakening quadrant.
BankNifty and Financial Services indexes continue to languish inside the lagging quadrant. There is a possibility that we may see some relative underperformance from these groups.
While the FMCG and Consumption Indexes are also inside the lagging quadrant, they appear to be consolidating and improving their relative momentum against the broader NIFTY500. NIFTY Pharma and Metal Indexes appear firmly placed inside the improving quadrant and are set to continue to relatively outperform the broader markets.
Important Note: RRG™ charts show the relative strength and momentum for a group of stocks. In the above chart, they show relative performance against NIFTY500 Index (Broader Markets) and should not be used directly as buy or sell signals.
Milan Vaishnav, CMT, MSTA
Consulting Technical Analyst
www.EquityResearch.asia | www.ChartWizard.ae


