Despite the past five days being immensely volatile, with the markets oscillating back and forth in a wide range, they still ended the week on a relatively flat note. The markets saw the opening of the week with a serious gap-down following geopolitical tensions between Russia and Ukraine; the very next day saw the markets recouping all the losses in an equally strong short-covering move. After oscillating back and forth to the tune of 600-points on either side, the remaining three days of the week were spent in a much narrower range. The headling index finally ended with a modest loss of 98.45 points (-0.57%) on a weekly basis.
The coming week will also have the current month derivative expiry; the sessions will remain influenced by the rollover-centric activities. The weekly options data suggest upside staying capped near 17500 as that level holds the highest Call OI. On the lower side, the Put OI remains at a maximum of 17000. This defines the likely range for the coming week, with all other external things staying as anticipated. The geopolitical tension between Russia and Ukraine is the only external factor that remains fluid. The previous week's low of 16809 will be crucial to watch; this point also coincides with the extended trend line that is acting as support at present.
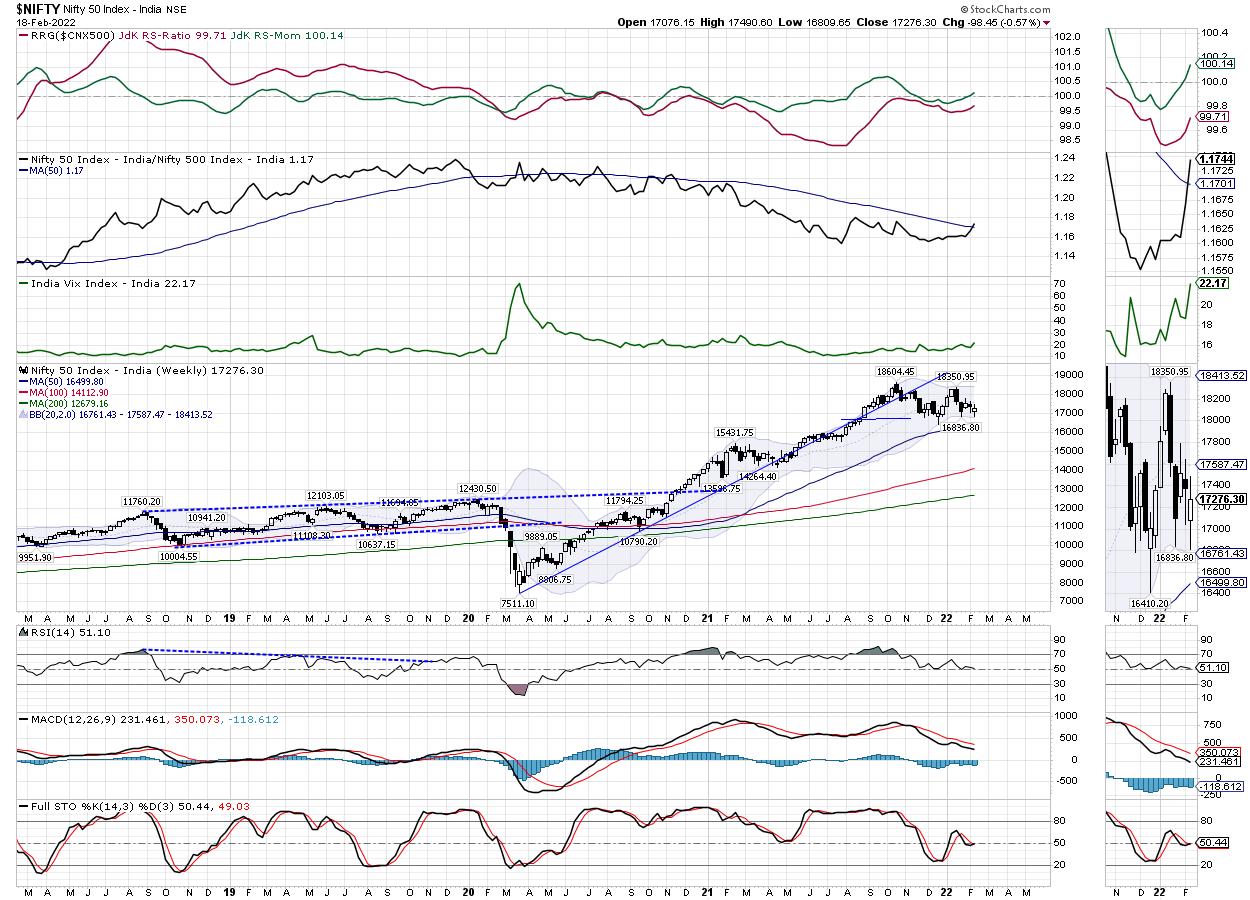
Volatility surged during the previous sessions; INDIAVIX spiked by 18.66% to 22.17 on a weekly note. The coming week is likely to begin on a tepid note; the levels of 17450 and 17550 will act as likely resistance points. The supports come in at 17100 and 16850 levels.
The weekly RSI is 51.08; it is neutral and does not show any divergence against the price. The weekly MACD is still bearish and below the signal line. A white body occurred on the candles; this shows that the NIFTY closed higher than the levels it opened at and, apart from this, no other formations are seen on the charts.
There has been a lot of noise on the daily charts; however, the pattern analysis of the weekly charts shows the NIFTY consolidating sideways in a very wide, but clearly defined, range. Currently, the index trades above all its three key moving averages; it is just below the 20-week MA, which presently stands at 17591. Over the coming days, the markets are likely to stay in a defined range; some defensive approaches may be observed, with few such pockets displaying resilience. It is recommended that you avoid large leveraged positions; while keeping overall positions light, a cautious and vigilant approach is advised.
Sector Analysis for the Coming Week
In our look at Relative Rotation Graphs®, we compared various sectors against CNX500 (NIFTY 500 Index), which represents over 95% of the free float market cap of all the stocks listed.
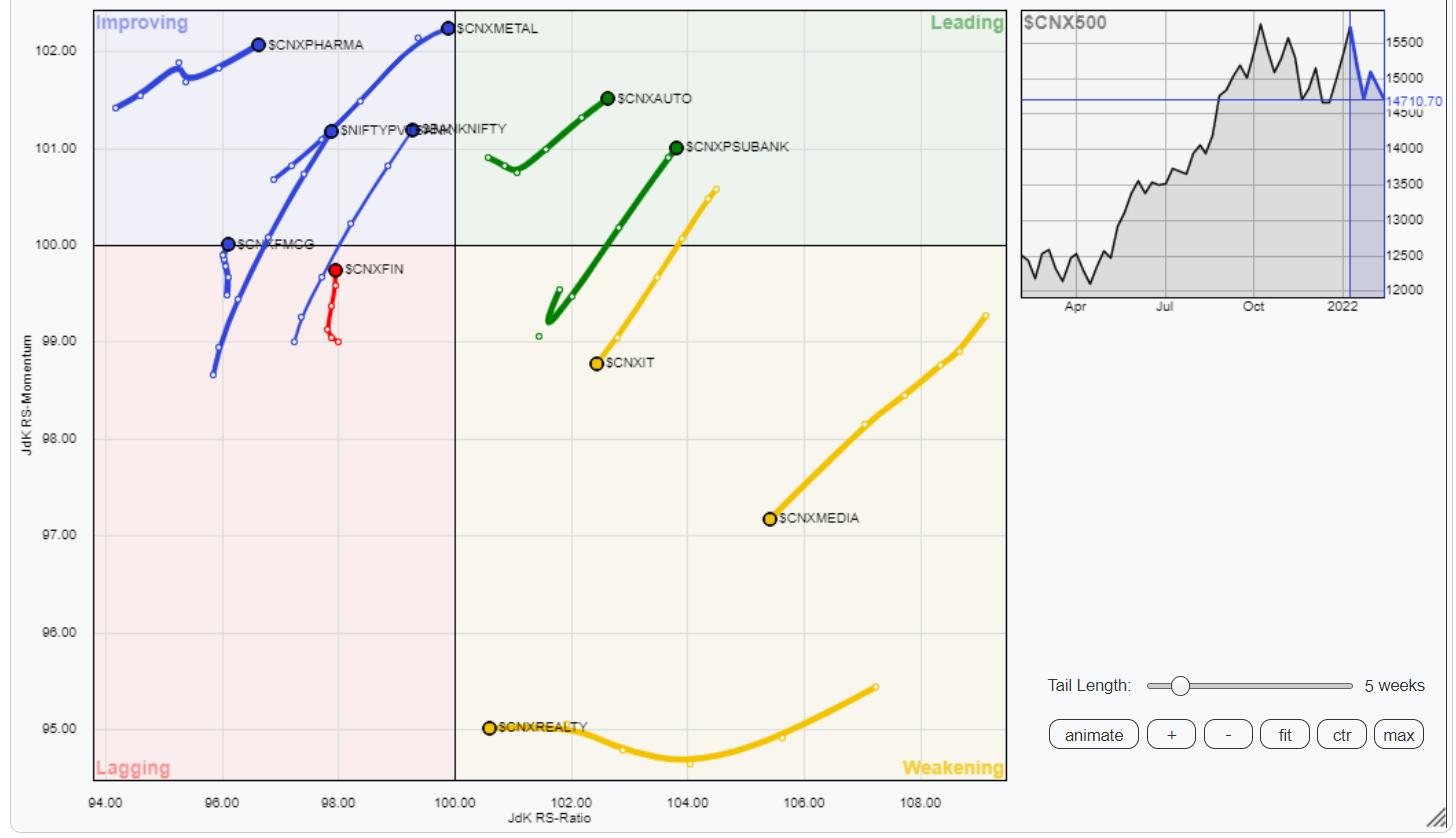
The analysis of Relative Rotation Graphs (RRG) shows that, apart from the Energy Index, which has taken the turn for the better while staying in the leading quadrant, the other sector positions remain largely unchanged. In addition to the Energy Index, the NIFTY Auto, Commodities, PSE, and the PSU Bank Index are also inside the leading quadrant.
The IT and the Realty Index are inside the weakening quadrant, along with the Infrastructure and the Media Indexes.
NIFTY Financial Service, Consumption, and the FMCG indices are inside the lagging quadrant. However, they appear to be improving on their relative momentum.
NIFTY Pharma, Metal, and the NIFTY bank indexes are inside the improving quadrant; on a weekly note, they are likely to continue showing resilient performance against the broader NIFTY500 Index.
Important Note: RRG™ charts show the relative strength and momentum for a group of stocks. In the above Chart, they show relative performance against NIFTY500 Index (Broader Markets) and should not be used directly as buy or sell signals.
Milan Vaishnav, CMT, MSTA
Consulting Technical Analyst
www.EquityResearch.asia | www.ChartWizard.ae


