After two weeks of corrective decline, the Indian equities tried to find a base for themselves, trading in a defined range and ending the week with some gains. The past five trading sessions remained as expected; the NIFTY has slipped below the 20-week MA and resisted to this level during the past sessions. The trading range remained lower as the NIFTY oscillated in 550.05 points as compared to 762.50 points in the week before this one. Although the trading range was lower, the market's attempts to find a temporary base for itself remained evident. Although a higher top and higher bottom were formed, the NIFTY did not take any major directional bias. The headline index ended with a net gain of 414.35 points (+2.42%) on a weekly basis.
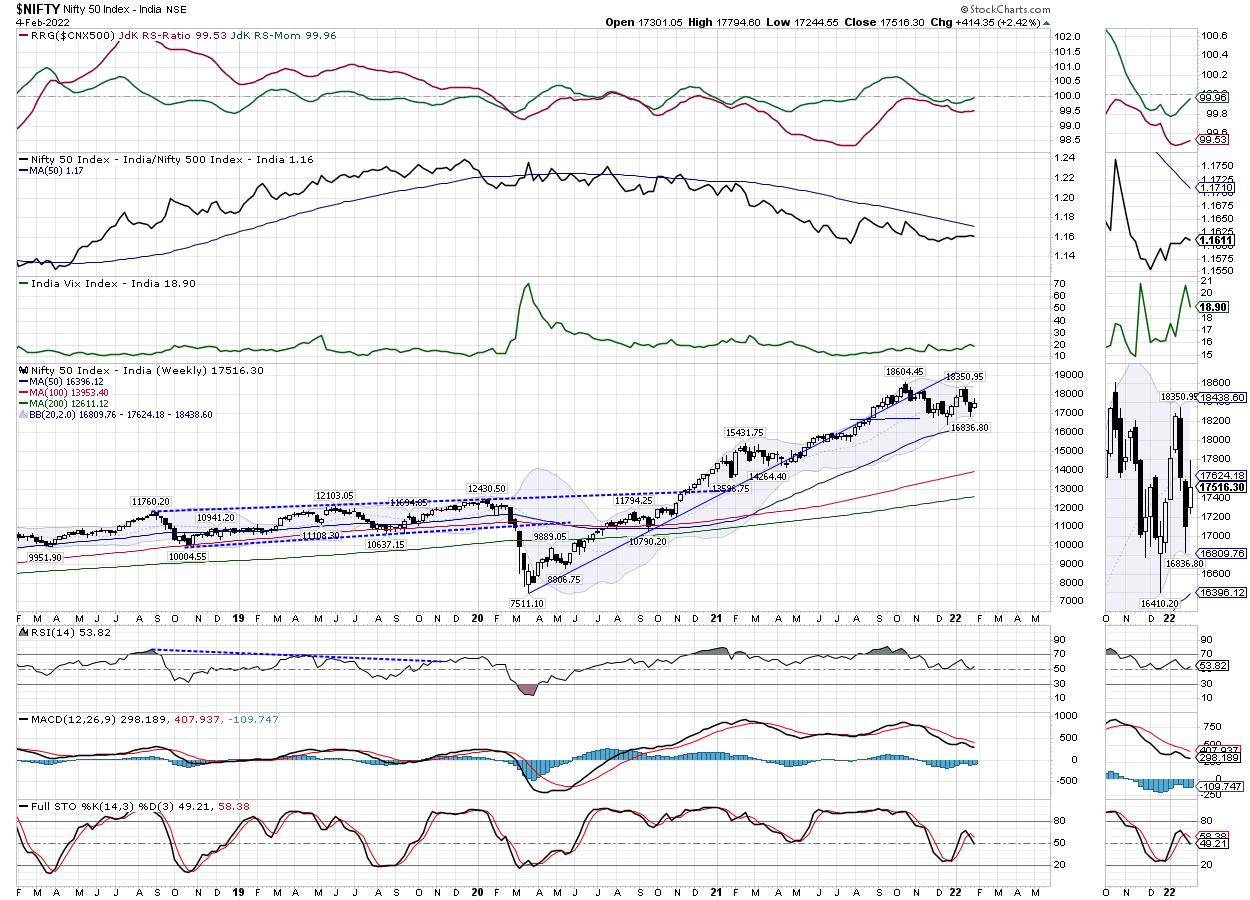
The monthly derivative expiry and the Union Budget are out of the way now; the Union Budget was one of the most important domestic events that the market faced and digested. The markets had approached the budget on a much lighter note and therefore did not see any major down moves after that. The volatility, too, remained lower; the INDIAVIX declined by 8.69% to 18.90 on a weekly basis. Beginning Monday, any reaction that we will see will be a mature reaction to the Budget and the related sectors in a much refined way, with the markets largely respecting the technical levels. Despite largely sharp corrective moves and Union Budget being done and dusted, the NIFTY has kept its primary trend intact.
The coming week is likely to see the levels of 17650 and 17830 acting as resistance levels. The supports come in at 17250 and 17000 levels. The technical supports and resistance points this week remain broader, making the likely trading range much wider than usual.
The weekly RSI is 53.79; it is neutral and does not show any divergence against the price. The weekly MACD is bearish and remains below the signal line. Apart from a white body that emerged, no other major formations were noticed on the candles.
The pattern analysis of the weekly chart shows that the NIFTY is well above the extended trend line pattern support. This extended trend line is drawn beginning from 15430 and joins the subsequent higher tops. The NIFTY is above this trend line and remains in a broad, well-defined range. It appears to be in a trading range on the higher timeframe charts.
All in all, the NIFTY is unlikely to make a major directional move over the coming week. On the higher side, it is unlikely to move above 17800 as per the options data unless there is any tactical shift; on the other hand, it is unlikely to violate the 17000 levels in the event of any resumption of the corrective move. We will see sector-specific outperformance continue. It is recommended that shorts must be avoided, and this consolidation phase should be used to pick the right stocks with strong relative strength. The pockets like banks, financials, oil and gas, infrastructure, and Auto are likely to put up a resilient show over the coming week.
Sector Analysis for the Coming Week
In our look at Relative Rotation Graphs®, we compared various sectors against CNX500 (NIFTY 500 Index), which represents over 95% of the free float market cap of all the stocks listed.
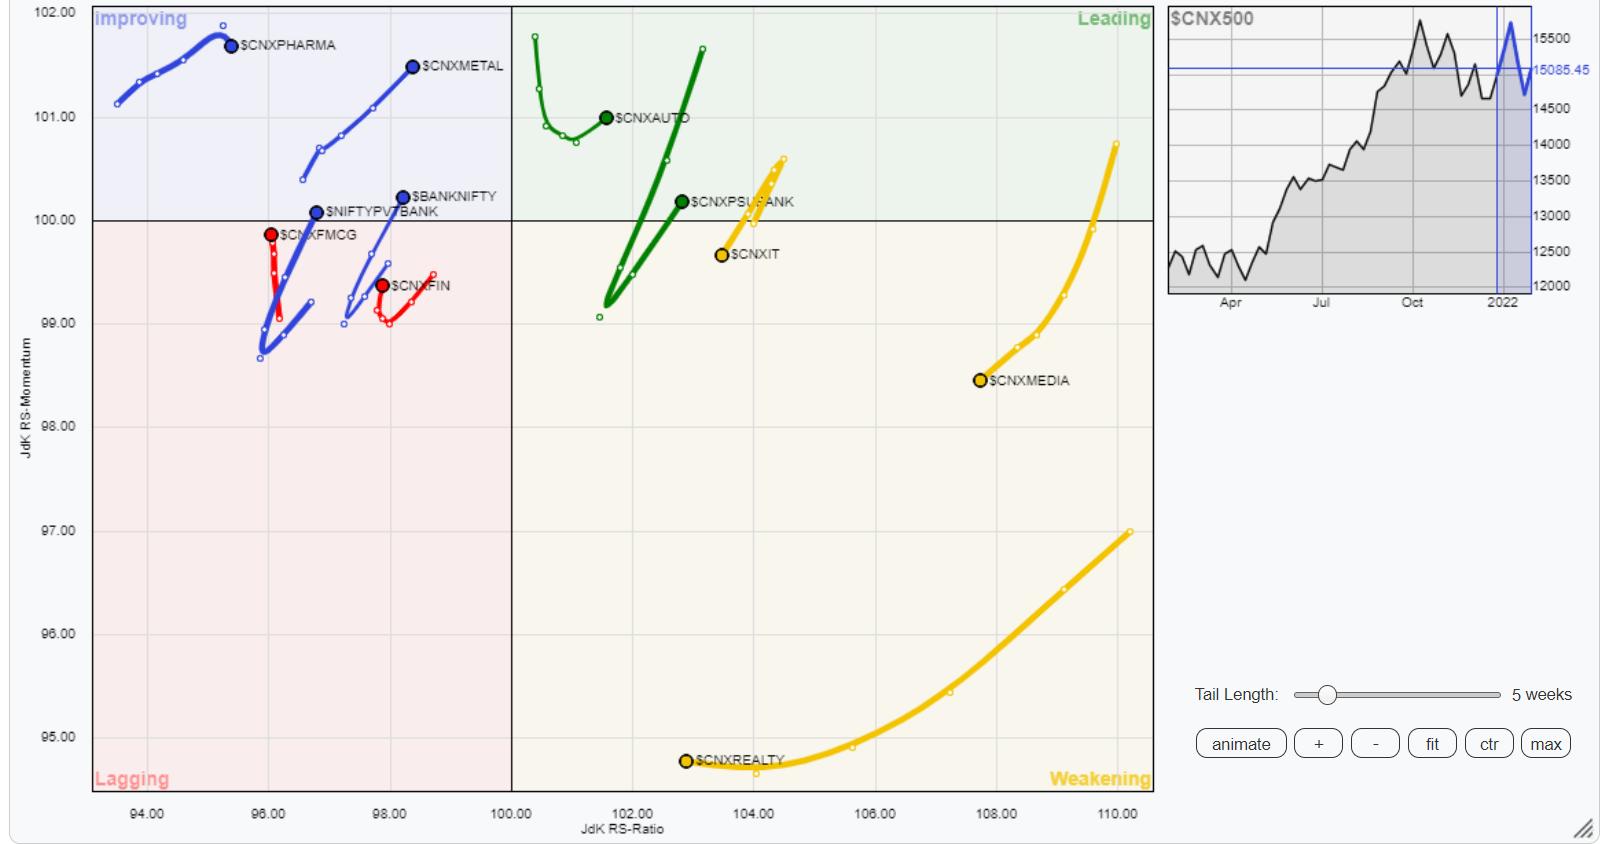
The analysis of Relative Rotation Graphs (RRG) shows possibilities of strong relative outperformance from Autos, Energy, PSE Index and the PSU Bank Index, as they are placed in the leading quadrant. The commodities index, which is inside the improving quadrant at present, is also seen firmly heading towards the leading quadrant.
The NIFTY Infrastructure, Media, and Realty Indexes languish inside the weakening quadrant along with the IT Index. Some individual performances from these groups may be seen, but, broadly, they appear giving up on their relative momentum against the broader NIFTY 500 Index.
The NIFTY Consumption Index is inside the lagging quadrant. Apart from this, the FMCG and Financial Services groups are also inside the lagging quadrant, but they appear to be improving on their relative momentum.
The NIFTY Bank Index has rolled inside the improving quadrant. This marks a potential end to the relative underperformance of this group. The NIFTY Pharma and Metal Indices are also inside the improving quadrant.
Important Note: RRG™ charts show the relative strength and momentum for a group of stocks. In the above Chart, they show relative performance against NIFTY500 Index (Broader Markets) and should not be used directly as buy or sell signals.
Milan Vaishnav, CMT, MSTA
Consulting Technical Analyst
www.EquityResearch.asia | www.ChartWizard.ae


