The week that went by fared very much on the expected lines. In the previous technical note, it was mentioned that, given the unabated up-move in the markets for a couple of weeks, perhaps it was time that the markets take a breather. In the week before this one, the NIFTY ended flat with mild gains. However, this week, over the past five sessions, what markets saw can be called a phase of classic consolidation. All five sessions were spent in a defined range, with the NIFTY oscillating back and forth after slipping below a major trend line pattern resistance. The trading range for the week remained narrower than usual, with NIFTY moving within a capped range of 381 points. Markets ended the week with a net weekly loss of 199.55 points (-1.12%).
The NIFTY navigated the monthly expiry on Thursday on a highly cautious note. Both domestic and the global markets also had a close eye on the Fed Chairman Jerome Powell's comments at Jackson Hole Symposium, which was flagged off on Friday in Wyoming. On the expected lines, the Fed indicated they would continue their measures until the inflation and the other macroeconomic figures reach the desired levels. Following its comments, the Dollar strengthened, Gold declined, and the US Markets also reacted in a very negative manner. The Dow declined 1008 points, while the broad market index S&P 500 declined 141 points. The technology index Nasdaq lost 497 points. On the domestic front, the NIFTY has continued to resist a major pattern resistance as well.
The coming week is a truncated one, with August 31, Wednesday, being a trading holiday on account of Ganesh Chaturthi. It is expected that the markets will start their week on a weaker footing following a weak global trade setup. This makes the levels of 17700 the most immediate resistance point for the NIFTY. The coming week is expected to see levels of 17600 and 17780 acting as resistance points. Supports are likely to come in near the 17400 and 17280 levels.
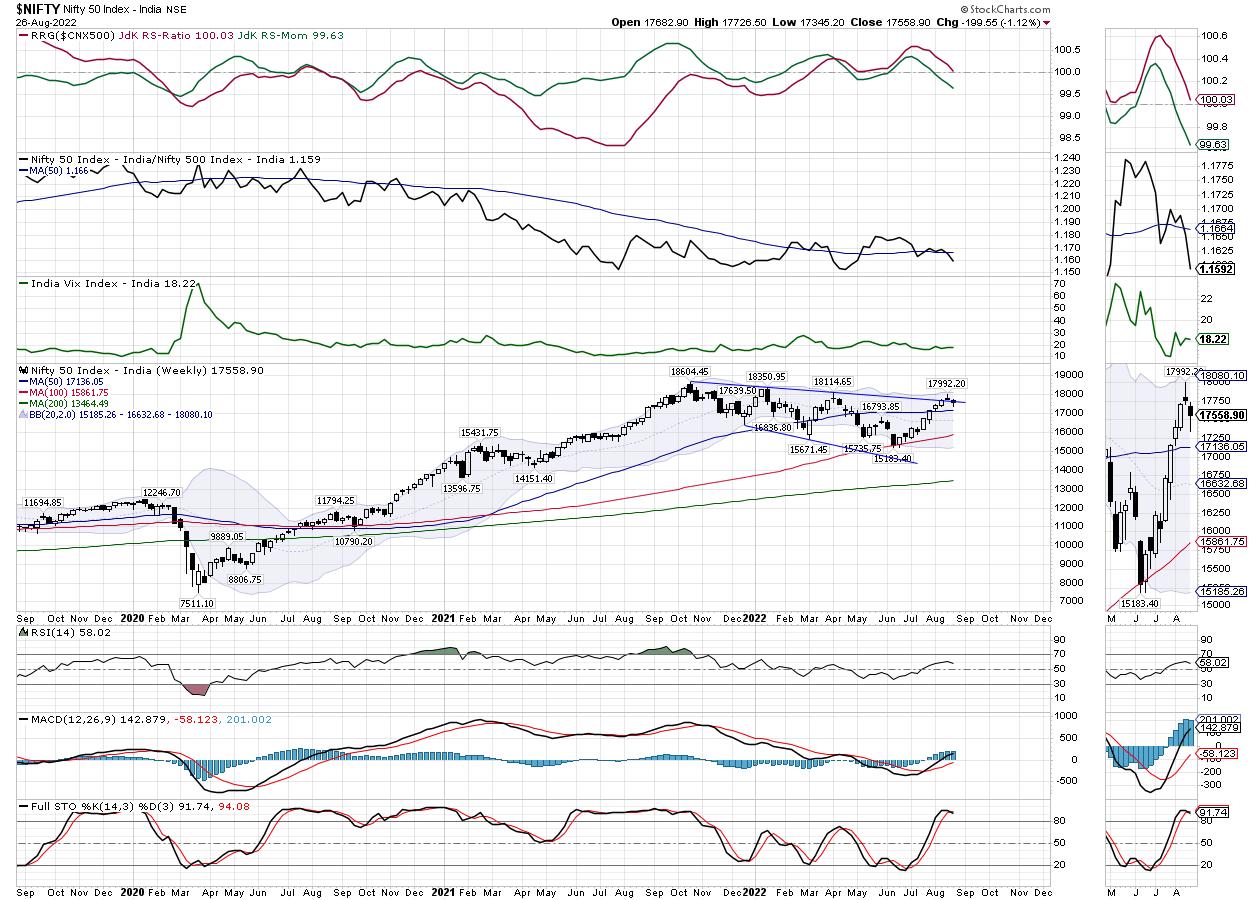
The weekly RSI is 58.01; it remains neutral and does not show any divergence against the price. The weekly MACD is bullish and above the signal line. A candle with a long lower shadow occurred. It is close to being called a Hanging Man; the only difference is that it has a small upper shadow. The formation of such a candle with a long lower shadow near a pattern resistance increases the possibility of the up move getting stalled for some more time and the markets staying under consolidation a bit longer. However, this will need confirmation on the next bar on the charts.
The pattern analysis of the weekly charts shows that the NIFTY continues to resist the important trend line pattern resistance. This is a falling trend line; it begins from the lifetime high point of 18600 and joins the subsequent lower tops. This makes the levels of 17700 the most immediate resistance point for NIFTY.
Overall, the coming week is likely to stay highly stock-specific in nature. It is unlikely that we will see any particular pocket or group of stocks or any particular sector dominating the landscape. We will see pockets of select stocks from various sectors outperforming the broader markets on a relative basis. Some knee-jerk reactions to the weak global trade setup cannot be ruled out; however, it is strongly recommended that shorting the markets must be avoided, so long as the NIFTY keeps its head above the 17300 level. A highly selective and cautious approach is advised for the coming week.
Sector Analysis for the Coming Week
In our look at Relative Rotation Graphs®, we compared various sectors against CNX500 (NIFTY 500 Index), which represents over 95% of the free float market cap of all the stocks listed.

The analysis of Relative Rotation Graphs (RRG) shows NIFTY Financial Services, MidCap 100, Consumption, Auto, PSU Bank and BankNifty remain in the leading quadrant. However, the Consumption and Auto groups are seen giving up on their relative momentum against the broader markets. The remaining pockets are likely to show relative outperformance against the broader NIFTY 500 index.
The NIFTY FMCG Index has rolled inside the weakening quadrant.
NIFTY Energy Index has rolled inside the lagging quadrant; however, it is seen improving on its relative momentum against the broader markets. The Pharma, Infrastructure and PSE indexes are also seen languishing inside the lagging quadrant. The Media and the Metal indexes are also inside the lagging quadrant; they are seen sharply improving in their relative momentum and may put up a resilient show over the coming days.
The Realty and the NIFTY Services sector indexes are placed inside the improving quadrant. The IT Index is also inside the improving quadrant, but the trajectory of the tail shows it getting weaker in terms of relative performance.
Important Note: RRG™ charts show the relative strength and momentum for a group of stocks. In the above Chart, they show relative performance against NIFTY500 Index (Broader Markets) and should not be used directly as buy or sell signals.
Milan Vaishnav, CMT, MSTA
Consulting Technical Analyst
www.EquityResearch.asia | www.ChartWizard.ae


