While continuing to stay resilient as they outperformed the global markets, the Indian equities delayed their breakout, continuing to resist the important pattern resistance on the charts. While a strong attempt to break above the crucial resistance zones was underway, the inflation figures again played a spoilsport; US markets reacted negatively to the inflation data, and the effect was seen on the Indian equities as well. The NIFTY retraced from the psychologically important 18000 levels as well in the process.
The markets saw a trading range of 598.90 points over the past five sessions. They finally ended with a net loss of 302.50 points (-1.70%) on a weekly basis. Had it not been for the loss seen on the last trading day of the week, the markets were headed for a flat closing.
Before moving on the examination of the technical structure of the Charts, it is important to note that the expected Fed rate hike that is slated to come up this week is also keeping the markets on the tenterhook. The recent inflation data has kept enough room for the Fed to come up with yet another rate hike of 75 bps; anything else higher than this would be taken very negatively by the markets.
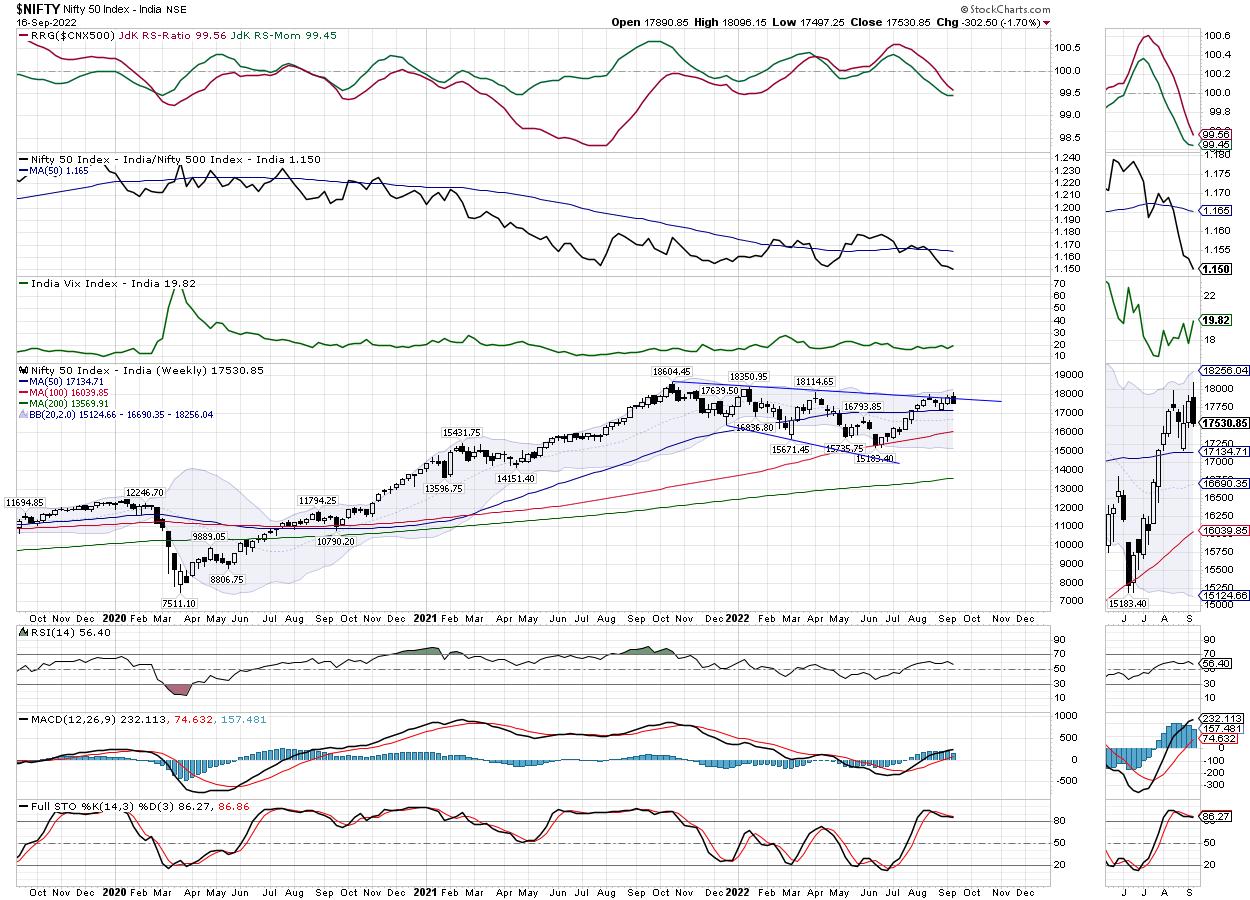
From the technical perspective, NIFTY not breaking out above the important falling trend line pattern resistance is a significant thing that needs to be noted. The said pattern trend line resistance is important, as it begins from the lifetime high point of NIFTY at 18600 and joins the subsequent lower tops. Not breaking out as yet above this resistance keeps the NIFTY in a broad trading range of 17700 on the upper side and the 50-Week MA on the lower side, which currently stands at 17136. This makes the zone of 17100-17700 a trading zone for the Index, unless a sustainable directional bias is established. The volatility also increased; the INDIAVIX rose by 11.88% to 19.82 during the week.
The coming week is likely to see the levels of 17700 and 18000 acting as resistance points. The supports will come in at 17400 and 17310 levels. The trading range is likely to stay wider than usual.
The weekly RSI is 56.40; it remains neutral and does not show any divergence against the price. The weekly MACD is bullish and stays above its signal line. No notable and important formations were seen on the candles.
Broadly speaking, the markets have become highly stock-specific; the best way to navigate such markets would be to stay with those stocks which have rising Relative Strength or, at least, improving relative strength. This will ensure that, while the markets perform, the stocks outperform the broader markets; however, in rough times, these stocks tend to offer great resilience to weakness. We will see select stocks from across the sectors putting up a good show; at the same time, we are unlikely to see any particular sector dominating the landscape.
Along with staying stock-specific and selective in the approach, it is also recommended to keep the overall exposures under control, avoid excessive leverage, and remain moderate and light on the overall exposures. A cautious approach is advised for the coming week.
Sector Analysis for the Coming Week
In our look at Relative Rotation Graphs®, we compared various sectors against CNX500 (NIFTY 500 Index), which represents over 95% of the free float market cap of all the stocks listed.
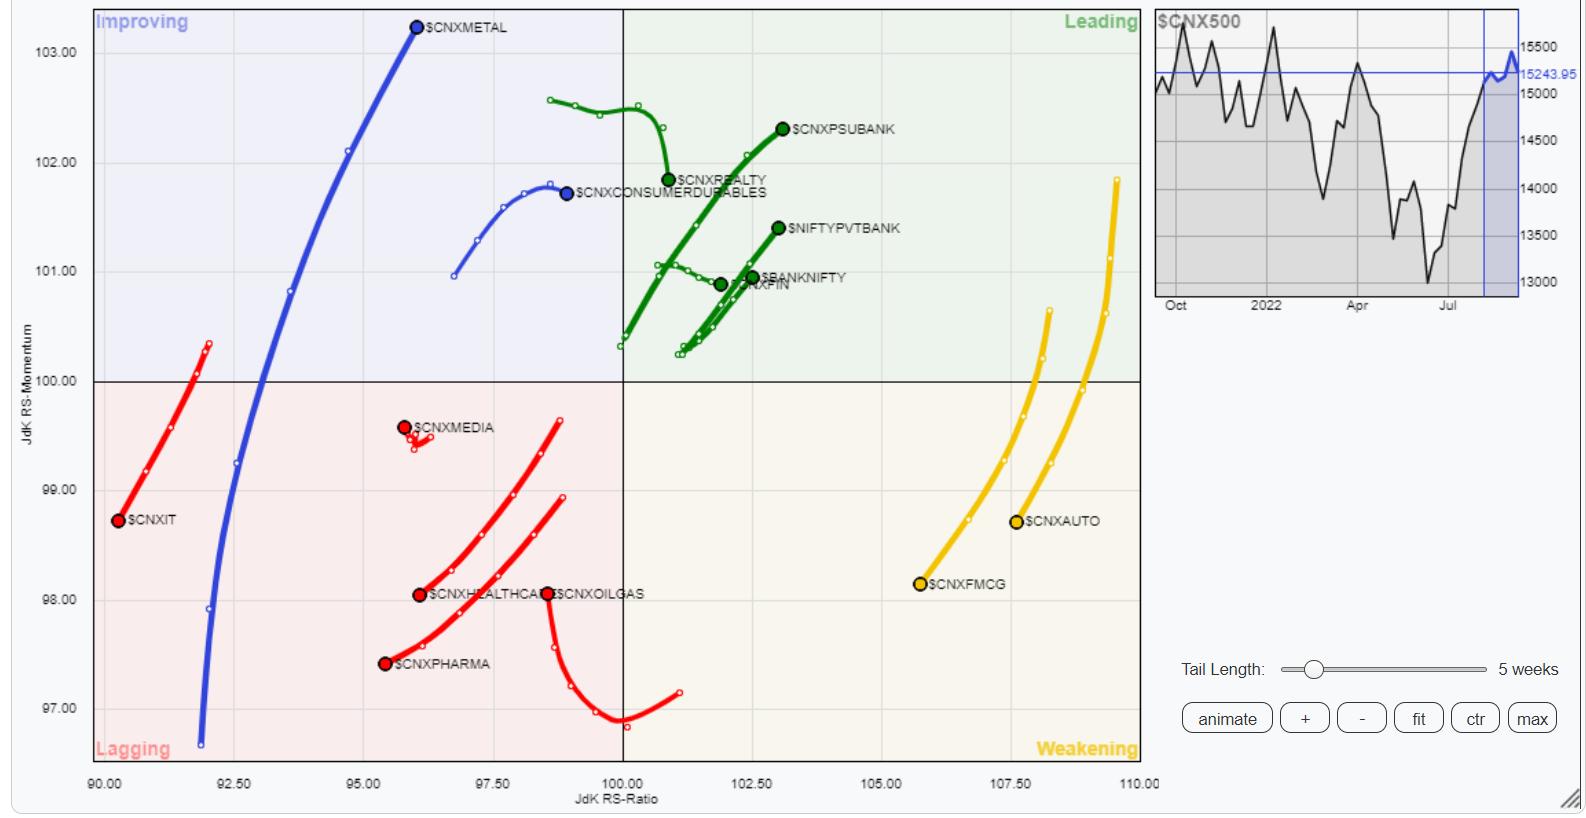
The analysis of Relative Rotation Graphs (RRG) does not show any material changes in the overall placement of the sectors. NIFTY Realty, Midcap 100, Financial Services, PSU Bank and BankNifty are situated inside the leading quadrant. These groups are likely to stay resilient and relatively outperform the broader NIFTY500 Index.
The NIFTY Consumption Index rolled inside the weakening quadrant. Besides this, the NIFTY Auto and NIFTY FMCG indexes remained inside the weakening quadrant.
NIFTY IT index continued to languish inside the weakening quadrant, along with NIFTY Media and Pharma Indexes. NIFTY Energy is also inside the weakening quadrant, but can be seen sharply improving on its relative momentum.
NIFTY Metal continued its large strides inside the improving quadrant with the NIFTY Commodities Index. These two sectors are also expected to show resilient performance against the broader markets.
Important Note: RRG™ charts show the relative strength and momentum for a group of stocks. In the above Chart, they show relative performance against NIFTY500 Index (Broader Markets) and should not be used directly as buy or sell signals.
Milan Vaishnav, CMT, MSTA
Consulting Technical Analyst
www.EquityResearch.asia | www.ChartWizard.aee


