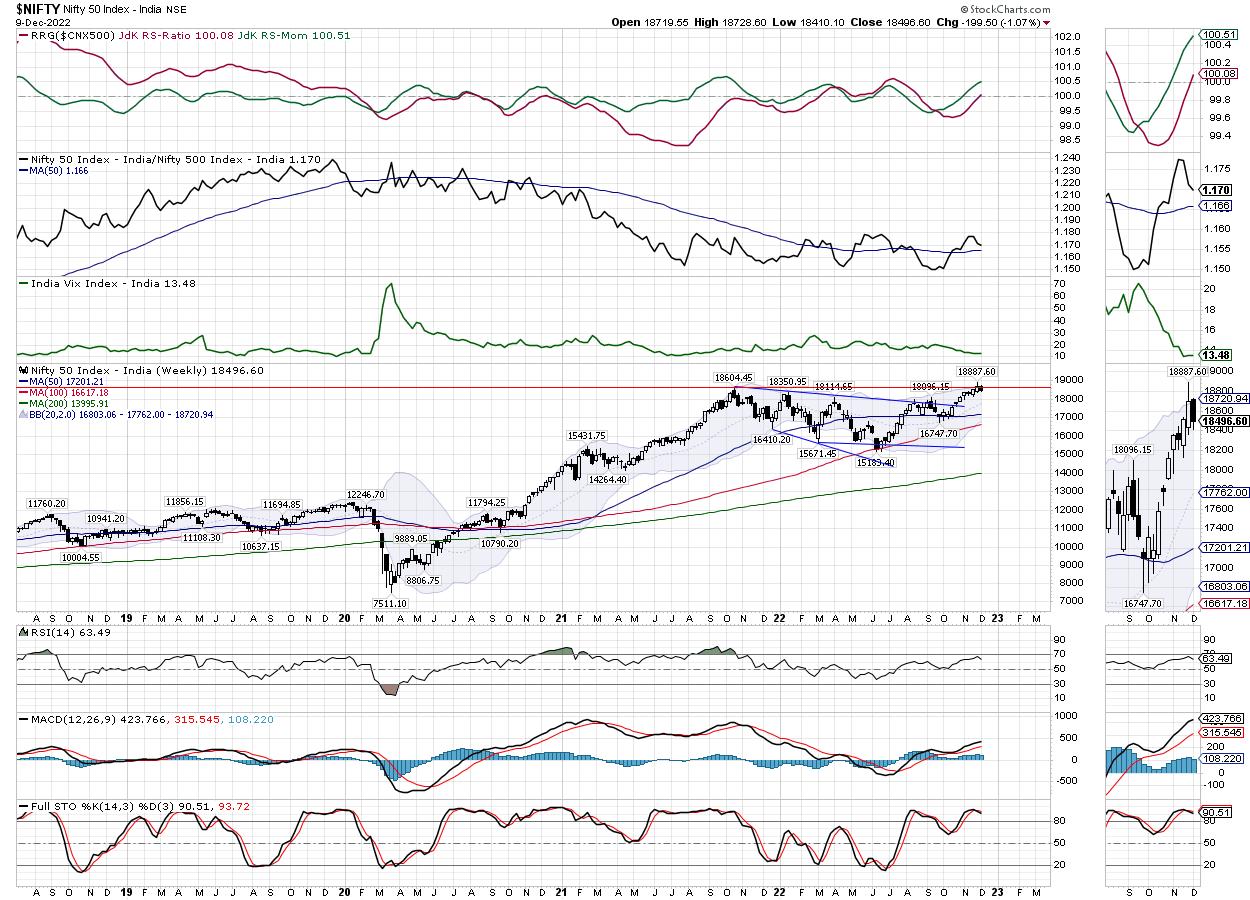
In the previous technical note, it was categorically mentioned that it would be crucial to see if NIFTY could keep its head above 18600 levels to extend and confirm the breakout that it has attempted. However, despite a strong relative outperformance from the NIFTY Bank Index, the NIFTY has delayed its breakout, ending below the 18600 level. Over the past five sessions, the index has struggled to stay above this crucial point; the trading range of the markets also decreased. NIFTY moved in a 318-point range through the week and ended with a net loss of 199.50 points (-1.07%) on a weekly basis.
In the coming week, all eyes should stay focused on 18600; the sooner the NIFTY crosses above this point, the better it will be for the index. Otherwise, it will continue to stay under corrective consolidation for some more time. Although December is typically a month with overall lesser volumes due to the holiday season, the Seasonality Charts show that, in the past 5 years, NIFTY has closed higher than it opened in December 60% of the time. In addition, it has relatively outperformed the NIFTY Bank index during December 60% of the time as well. Playing catchup to the NIFTY Bank Index would be required if the NIFTY is to re-work the otherwise failed breakout attempt.
Volatility hardly changed; INDIAVIX rose by a negligible 0.20% to 13:48 on a weekly note. The coming week is likely to see levels of 18600 and 18950 acting as potential resistance points. The supports come in at 18480 and 18300.
The weekly RSI is 63.49; it remains neutral and does not show any divergence against the price. The weekly MACD is bullish and remains above the signal line.
The pattern analysis of the weekly chart shows that the NIFTY attempted a breakout by moving past its previous lifetime high of 18600; however, this breakout did not materialize, as the index slipped below its breakout point. Right now, it sits below the important 18600 level; only a move above this point will see the index attempting a breakout again. There is an inside bar formation on the chart; directional bias would come only if the high or the low point of the previous week is taken out.
It was also mentioned in the previous technical note that the market breadth remains a concern and may play a contributing role in preventing the NIFTY from achieving a clean breakout. This remains a concern, and it would be essential for the market breadth to improve for any sustainable move on the upside. That being said, unless this happens, we will see the markets staying highly stock-specific and leadership being limited to only certain pockets.
The cumulative PCR across all expiries for NIFTY is at 0.76, Going forward from here, the best way to navigate these markets would be to keep leveraged positions under control and overall exposures at modest levels. It would be prudent to keep protecting profits on either side unless the previous week's low point (18365) is violated or the high point (18887) is taken out. A cautious approach is advised for the coming week.
Sector Analysis for the Coming Week
In our look at Relative Rotation Graphs®, we compared various sectors against CNX500 (NIFTY 500 Index), which represents over 95% of the free float market cap of all the stocks listed.
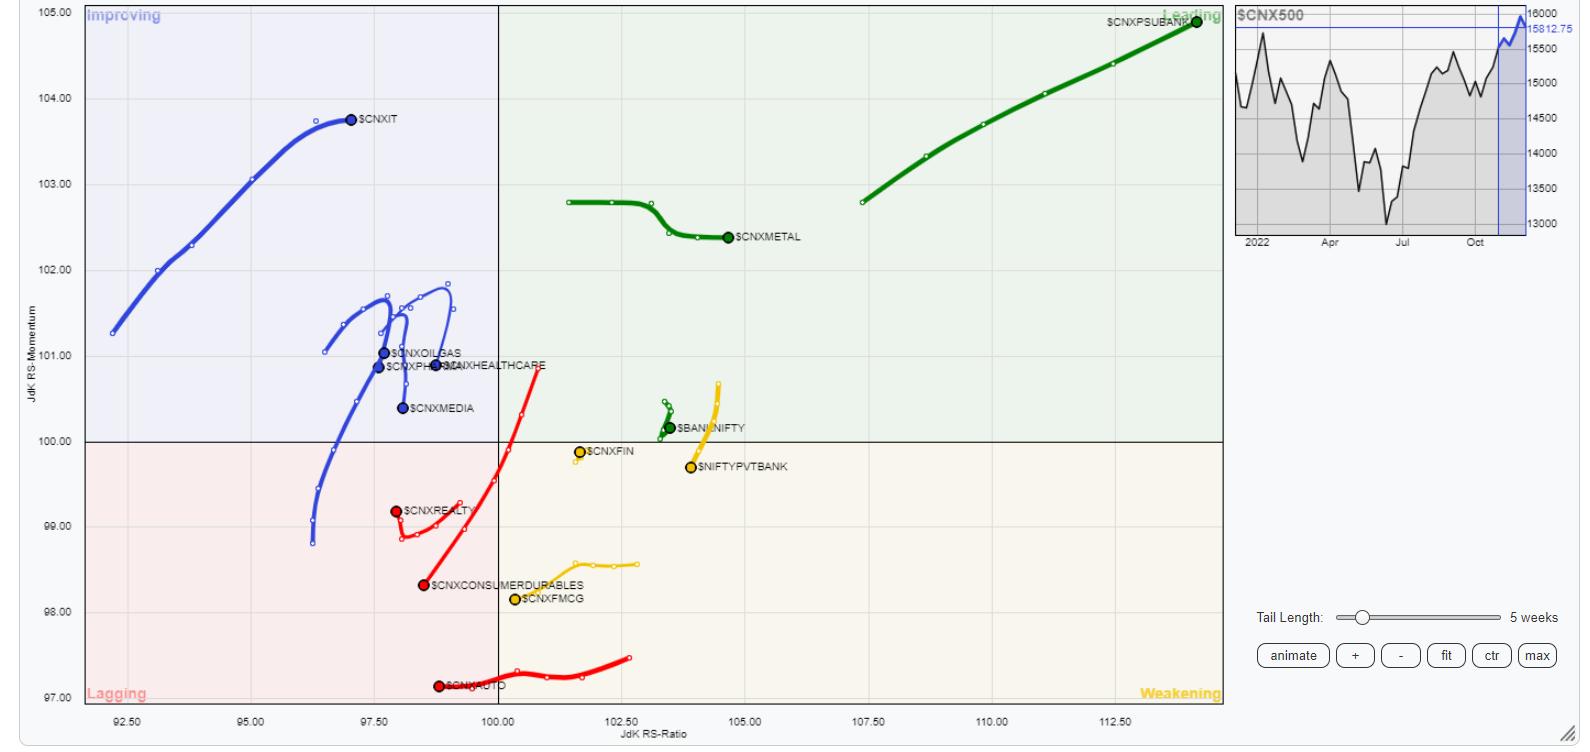
The analysis of Relative Rotation Graphs (RRG) shows a few of the sectors silently preparing themselves for a good relative performance in the coming week. The PSU Bank and Metal Indexes are firmly placed inside the leading quadrant and are set to continue relatively outperforming the broader NIFTY 500 Index. The Services Sector and the NIFTY bank are also inside the leading quadrant and may relatively outperform the broader markets.
Despite staying in the weakening quadrant, the NIFTY Financial Services sector can be seen improving its relative momentum. Besides this, the Midcap 100 and FMCG index continue to remain inside the weakening quadrant.
The Consumption Index is languishing inside the leading quadrant, along with the Auto Index. The Energy and the Realty indexes, too, are inside the lagging quadrant, but appear to be sharply improving their relative momentum against the broader markets.
Despite a weak show in the previous week, the NIFTY IT Index remains well-placed inside the improving quadrant, along with the Commodities, Infrastructure, and PSE Index. These groups are likely to see stock-specific performance over the coming days. It is the Pharma and Media indexes that can be seen giving up their relative momentum against the broader markets, despite being in the improving quadrant.
Important Note: RRG™ charts show the relative strength and momentum for a group of stocks. In the above Chart, they show relative performance against NIFTY500 Index (Broader Markets) and should not be used directly as buy or sell signals.
Milan Vaishnav, CMT, MSTA
Consulting Technical Analyst
www.EquityResearch.asia | www.ChartWizard.ae


