The equity markets have entered into the new year on a back foot and stayed choppy as well. In the previous technical note, it was mentioned that, so long as the NIFTY stays below its crucial resistance zone of the 18300-18600 levels, it will remain in a trading zone that it has created for itself. The range also remained unchanged, the index oscillating 456 points over the past five sessions; the last three sessions saw the markets staying under strong corrective pressure. However, the index has maintained its short-term support point; it ended with a net loss of 245.85 points (-1.36%) on a weekly basis.
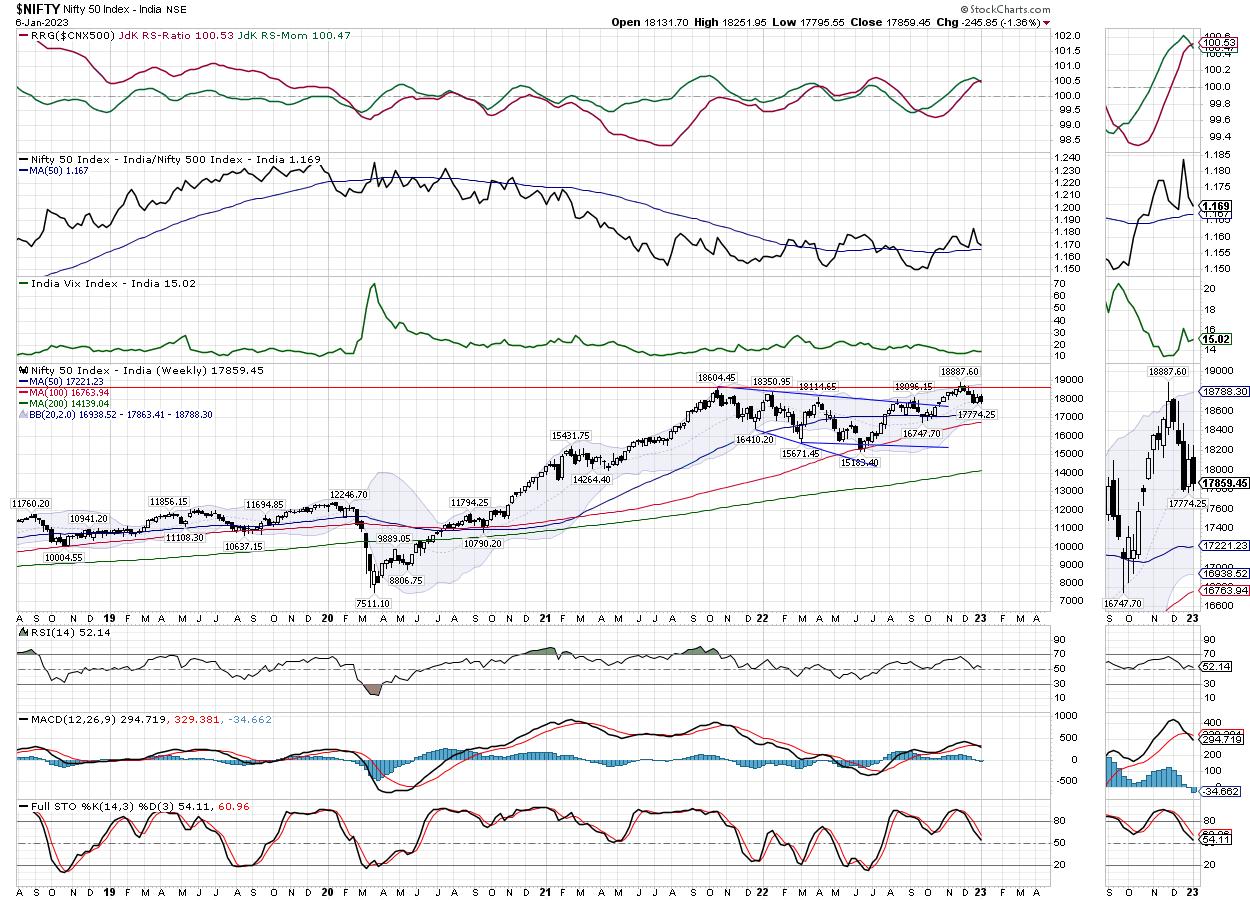
Navigating the coming week is not going to be easy; the US markets have ended on a strong note and this will see our markets opening stronger as well. However, the behavior of the NIFTY near 18300 and between 18300-18600 levels will be extremely crucial to watch over the coming days and weeks. Unless this zone is not navigated on the upside meaningfully, the markets will not only trade in a broad trading range, but will also remain susceptible to corrective bouts from higher levels. Volatility moderately inched higher; INDIAVIX rose by 1.06% to 15.02.
While inheriting positive global cues, the markets may see a positive start to the week. The coming week is likely to see the levels of 18040 and 18290 acting as potential resistance points. The support will come in at 17600 and 17480 levels. The trading range may get a bit wider this week.
The weekly relative strength index (RSI) is 52.14; it remains neutral and does not show any divergence against the price. The weekly moving average convergence/divergence oscillator (MACD) has shown a negative crossover; it is now bearish and trades below the signal line.
The pattern analysis of the weekly chart shows that, after a failed breakout and slipping below the crucial 18600 level, the NIFTY is taking support at the 20-week moving average (MA), which currently stands at 17863. The index has ended a notch below this point, but the expected positive start will see NIFTY trading above this level. However, staying above this 20-week MA on a closing basis will be important for the index.
The coming week should be approached on a similar note; you would need to approach it as cautiously as the previous week. On the daily chart, the level of 100-day MA has been retested; while the index has ended slightly below this level, it would be necessary to defend this level on a closing basis to stay under a broad consolidation and avoid any incremental weakness. It is strongly recommended to continue keeping overall leveraged exposures at modest levels. There was a sharp decline in U.S. Dollar Index on Friday; this is likely to auger well for commodities and metal stocks. A cautiously positive outlook is advised for the coming week.
Sector Analysis for the Coming Week
In our look at Relative Rotation Graphs®, we compared various sectors against CNX500 (NIFTY 500 Index), which represents over 95% of the free float market cap of all the stocks listed.
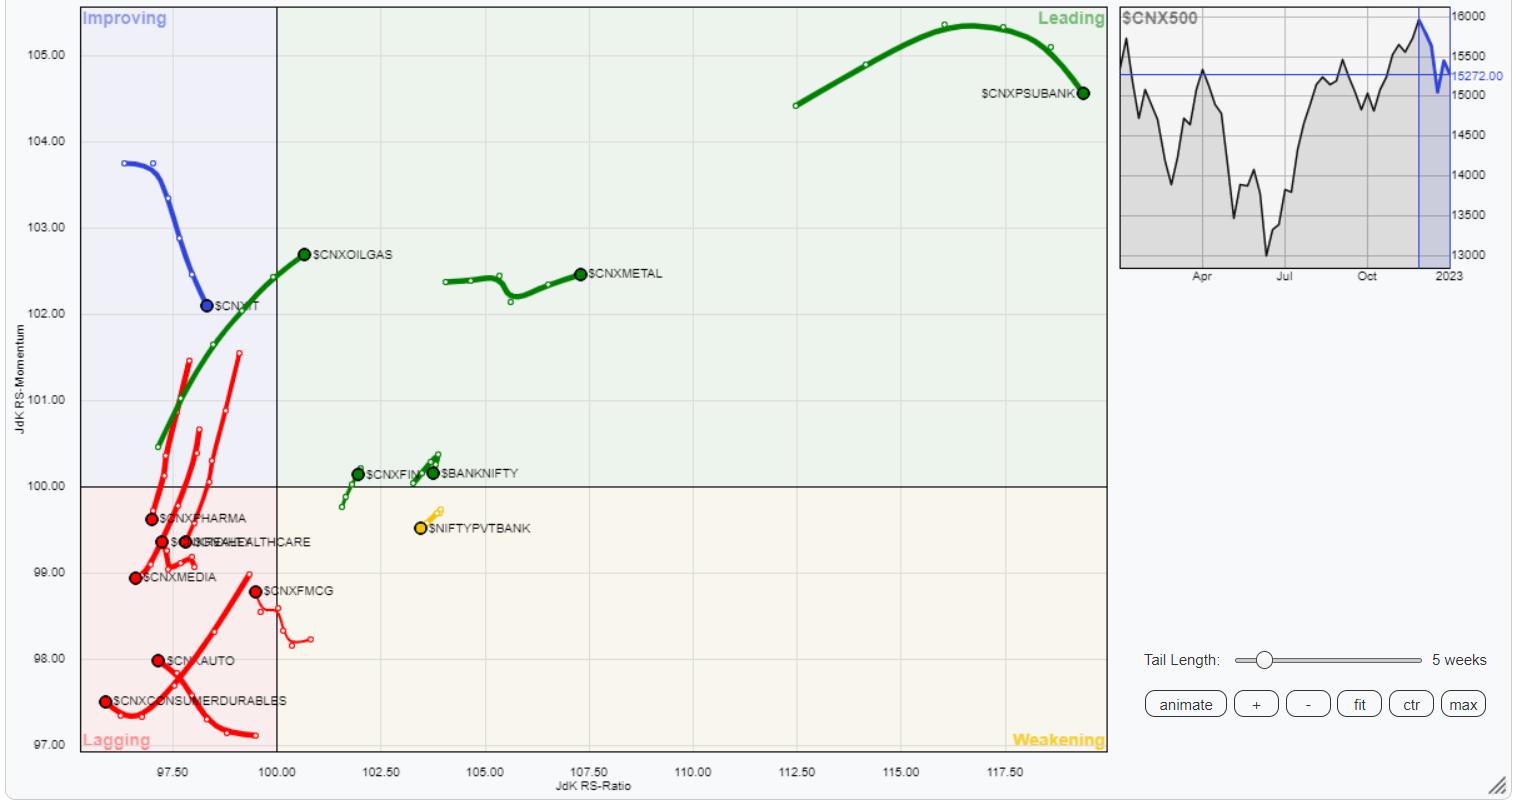
The analysis of Relative Rotation Graphs (RRG) shows no major changes in the sectoral setup compared to the previous week. We have the Commodities, Financial Services, PSU Banks, BankNifty, PSE, Infrastructure, and Services Sector indices inside the leading quadrant. All these groups are set to relatively outperform the broader markets.
The Services Sector and NIFTY Bank index are showing slight weakness in their relative momentum; this may lead to some muted performance from these groups.
The NIFTY Midcap 100 and FMCG indexes are inside the lagging quadrant; however, they are seen improving on their relative momentum. NIFTY Auto, Consumption, Media, and Pharma groups are seen languishing inside the lagging quadrant.
NIFTY Energy is inside the improving quadrant, along with the IT index. It is likely to show stock-specific isolated relative outperformance in the coming week.
Important Note: RRG™ charts show the relative strength and momentum for a group of stocks. In the above Chart, they show relative performance against NIFTY500 Index (Broader Markets) and should not be used directly as buy or sell signals.
Milan Vaishnav, CMT, MSTA
Consulting Technical Analyst
www.EquityResearch.asia | www.ChartWizard.ae


