It was the second week in a row that the markets did not make any major headway, staying directionless and ending with just modest gains. The previous days have seen volatility declining; the VIX remains at one of its lowest levels of the recent past. This week as well, there was not much increase in the volatility. The market sentiment remained calm, with volatility staying very low. The trading range also remained modest; the past five days saw the NIFTY oscillating in a trading range of 415 points. While continuing to resist the important levels, the NIFTY ended with a modest gain of 87.70 points (+0.49%) on a weekly basis.
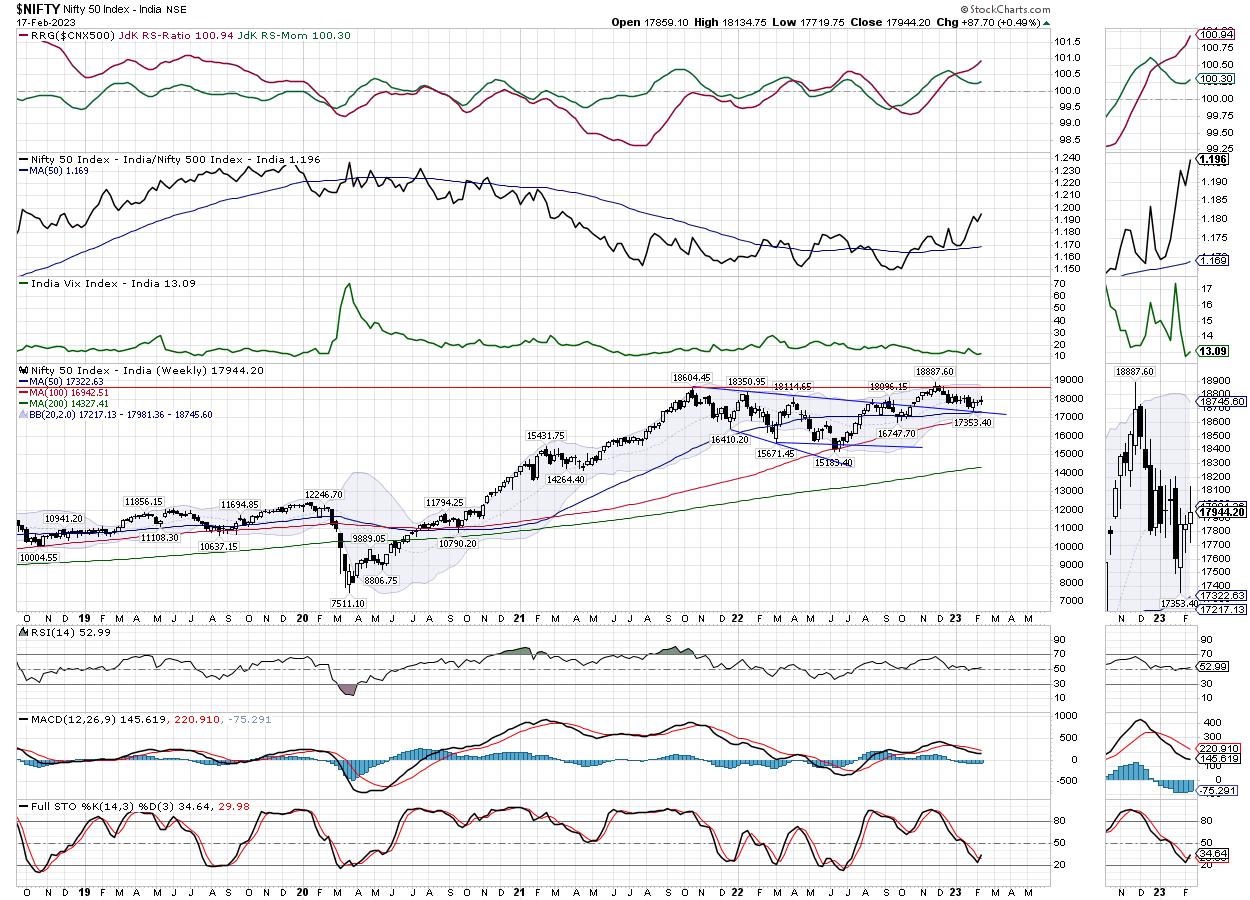
The 20-Week MA, which presently stands at 17981, has assumed some importance on the weekly charts over the past many weeks. While the NIFTY was trading higher, it took support on this support level for five weeks in a row. After the Index violated and slipped below this support, NIFTY resisted the 20-Week MA for the third week in a row. On the daily chart, NIFTY has closed just a notch below the crucial 100-DMA, which is placed at 17967. With the 50-DMA placed at 18033, the NIFTY has multiple resistance levels to navigate between 17950-18050 levels on both daily and weekly charts. In other words, some meaningful up move will happen only after NIFTY moves past 18000 – 18100 levels convincingly.
INDIAVIX, the volatility barometer, which has been trading near its lowest levels of recent times, inched 2.67% higher to 13.09. This remains a cause of concern in the near-term. The markets may see a quiet start to the week. The levels of 18100 and 18250 are likely to act as potential resistance points. The supports come in at 17900 and 17780 levels.
The weekly RSI is at 52.99; it remains neutral and does not show any divergence against the price. The weekly MACD is bearish and trades below the signal line.
The pattern analysis shows that the NIFTY experienced a failed breakout when it was unable to significantly move past the previous high point of 18600. It just made an incremental high, saw a corrective move, and slipped below the breakout point, resulting in a failed breakout. Currently, it is seen resisting multiple resistance points on the daily and weekly charts that are in close proximity to each other. The overall pattern analysis shows that a meaningful up move will happen only after NIFTY moves past 18100 levels convincingly and stays above that point. Until this happens, we are likely to see all up moves facing stiff resistance at higher levels.
All other technical factors aside, the low level of VIX is a cause of concern for the near-term. The persistently low levels of VIX indicate a period of low volatility and denotes complacency of the market participants. This is supposed to be taken with a tinge of caution. Any spike in VIX, which is absolutely normal if this indicator remains low for a long time, can be harmful to the markets.
Unless the Index moves past 18100 levels, the markets will not see any runaway up move. The overall approach to the markets needs to be stock-specific and selective over the coming days. We will see defensive and low-beta stocks doing better; we are also likely to see isolated outperformance from the banking, IT, financial, and Auto sectors.
The coming week is expected to wear a defensive look; it is likely that pockets like FMCG, Pharma, IT, PSE, etc. may do well. While select outperformance from other sectors cannot be ruled out, it would be wise to stay invested in low-beta stocks that tend to show much lower volatility. The VIX being at one of its lowest levels remains a concern and, given this fact, the markets need to be approached on a highly cautious note over the coming days. However, unless the key resistance points are taken out, leveraged exposures must be kept at modest levels. A cautiously positive outlook is advised for the coming week.
Sector Analysis for the Coming Week
In our look at Relative Rotation Graphs®, we compared various sectors against CNX500 (NIFTY 500 Index), which represents over 95% of the free float market cap of all the stocks listed.
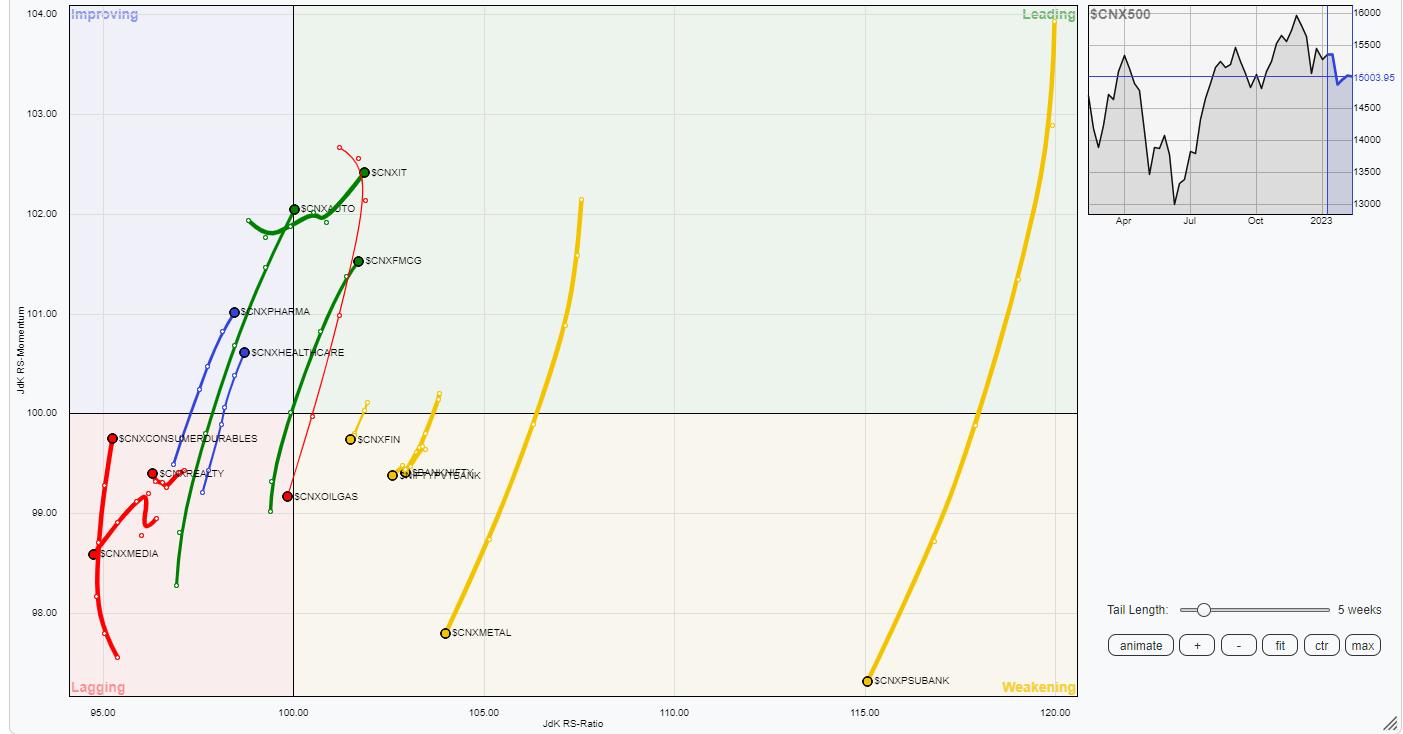
The analysis of Relative Rotation Graphs (RRG) shows that the Auto Sector Index has also rolled inside the leading quadrant; it joins the NIFTY IT and the FMCG Index, which are firmly placed inside the leading quadrant. These groups are set to relatively outperform the broader NIFTY 500 Index. The NIFTY PSE Index is also inside the leading quadrant.
On the other hand, NIFTY Infrastructure Index has rolled inside the weakening quadrant. Besides this, the NIFTY Commodities, Financial Services, Services Sector, NIFTY Bank, Metal, and the PSU Bank indices are also inside the weakening quadrant.
NIFTY Realty, Media, and the Energy Indices are continuing to languish inside the lagging quadrant. NIFTY Consumption Sector index is also inside the lagging quadrant; however, it is seen sharply improving on its relative momentum against the broader markets.
The NIFTY Pharma index is inside the improving quadrant; this may continue to see resilient performance against the broader markets in the coming week.
Important Note: RRG™ charts show the relative strength and momentum of a group of stocks. In the above chart, they show relative performance against NIFTY500 Index (Broader Markets) and should not be used directly as buy or sell signals.
Milan Vaishnav, CMT, MSTA
Consulting Technical Analyst
www.EquityResearch.asia | www.ChartWizard.ae


