
The Metals and Commodities stocks have been relatively outperforming the broader markets for a couple of months now. This was the period when the US Dollar Index (DXY) underwent a strong corrective move after testing the highs of 114.77 in September. The retracement in the Dollar Index was a bit severe, which meant strong moves in the metals and commodities stocks when DXY tested the lows of 100.80 in the early days of February this year.
The metals and commodities prices enjoy an inverse relation to the US Dollar. In simpler words, while a strong Dollar is not good for the prices and in other words, a declining US Dollar is generally bullish for metals and commodities. So, while the DXY corrected from the September 114.77 levels until the most recent low of 100.82 seen in early February, this period saw a strong performance from the metals and commodities stocks.
However, the US Dollar Index rebounded from the low of 100.82 to almost 105.50 and, because of this, the metals and commodities stocks remained largely under pressure. However, the DXY has tested its most immediate resistance zone of 105.50-106 and, if it retraces again from the current levels, we may see some respite in the metals and commodities stocks.
HINDALCO.IN
This large-cap metal stock went on a roll when it rallied from the low of 306 formed in June 2022 to the high of 504 formed in January this year. Over the past four weeks, the stock has been under some corrective pressure. However, a few signs have emerged that hint at a potential bottom being put in place. This lays the ground for a likely technical rebound from the current levels.
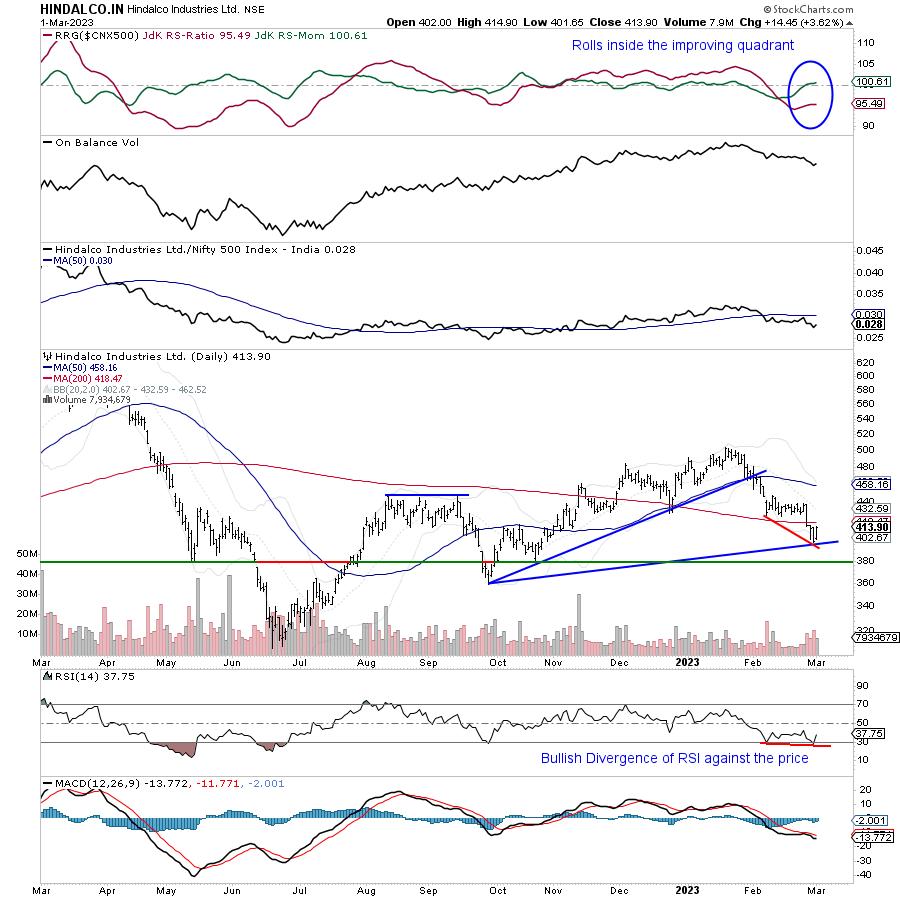
The first turn on the downside saw the stock slipping below the 50-DMA, which was almost acting as a proxy trend line for the stock. Subsequently, as the corrective move deepened, the stock also slipped below its 200-DMA, which is presently placed at 418.
The most current phase of the down-move has come with a strong bullish divergence of the RSI against the price. This bullish divergence developed as the stock made lower bottoms, but the RSI did not. The stock has also attempted to take support at a rising trend line pattern support; this trend line begins from the low of 358 and joins the subsequent higher bottom.
The RSI otherwise remains neutral and does not show any divergence against the price. The stock has also rolled inside the improving quadrant of the RRG when benchmarked against the broader NIFTY 500 Index. This points to a likely beginning of a phase of relative outperformance of the stock against the benchmark, i.e., the broader markets.
The RS line against NIFTY 500 has flattened, but has not started to rise as of yet. This may improve with the likely improvement of the relative performance of the stock.
If the current technical setup resolves on the expected lines and if the technical rebound does take place, then it may see the stock testing 440-445 levels in the coming days. Any close below 377, though, will negate this view.
and
Milan Vaishnav, CMT, MSTA | Consulting Technical Analyst | www.EquityResearch.asia | www.ChartWizard.ae


