VIX rose through the week, and so did the NIFTY. Over the past five sessions, the Indian equity markets continued to inch higher, showing a lot of resilience, and ended with a modest gain over the week. Over the past several weeks, the persistently low levels of VIX have remained a concern; this volatility gauge violated its pre-pandemic 2020 lows when it closed below 11 levels. This indicator also rose; the markets continued to pile up some gains as well. The NIFTY 50 index moved in a 289.40 points range and ended towards its high point just below the key resistance levels. The headline index closed while posting net gains of 245.80 points (+1.36%) on a weekly basis.
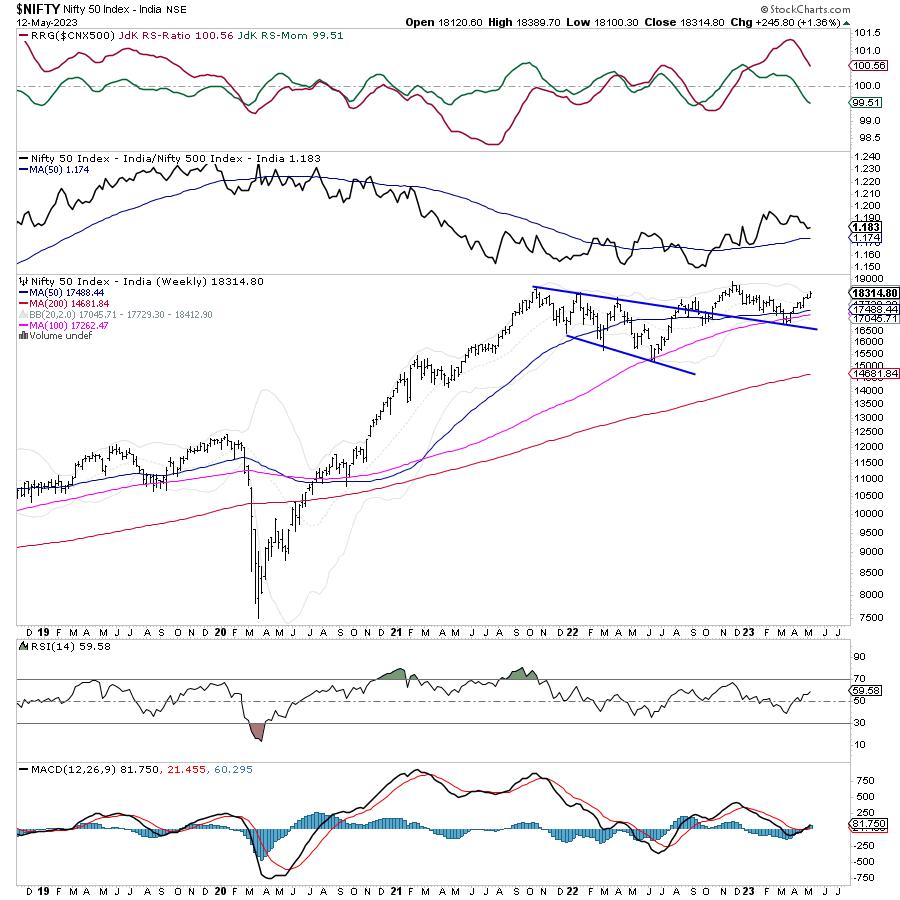
Markets remain at a crucial juncture from a technical standpoint. On short-term charts, NIFTY has resistance in the 18300-18350 zone, as indicated by the Options data. However, looking at the weekly charts, there is a strong pattern resistance in the 18450-18500 zone; unless this zone is taken out comprehensively, no runaway up moves are expected. This very thing, if viewed with a different perspective, means all upsides in the NIFTY, if any, shall remain capped in nature. INDIAVIX rose by 4.53% to 12.85 during the week; it still remains relatively at much lower levels.
Monday is likely to see a quiet start to the week; the levels of 18390 and 18490 are likely to act as potential resistance points. The supports would come in at the 18180 and 18000 levels.
The weekly RSI is at 59.58; it has marked a new 14-period high, which is bullish. However, it remains neutral and does not show any divergence against the price. The weekly MACD is bullish and above the signal line.
The pattern analysis of the weekly charts shows that, by moving towards the 18500 levels, it is attempting to form and test a triple-top; any move towards the 18500-18600 levels will see the NIFTY testing this level for the third time since October 2021. While any meaningful breakout may lend more strength to the Index, as of now, the zone/level of 18500 is a very strong resistance for the Index. As of now, this zone stands as a very stiff resistance for the Index unless taken out convincingly.
All in all, even though both the Indices; Nifty and BankNifty, are posting incremental highs, markets remain vulnerable to consolidation at current levels. Without any corrective retracement or any consolidation, the present up-move has gotten a bit unhealthy. BankNifty has been relatively much stronger; it may continue to relatively outperform the NIFTY, but any corrective move shall make this index more volatile and susceptible to profit-taking bouts. As of now, there are no signals to suggest the onset of any major corrective move, but markets are vulnerable to some consolidation and corrective actions.
It is strongly recommended that one must continue to approach the markets on a highly selective note. It would be prudent to stay invested in defensive, low-beta, and relatively stronger stocks. Overall, while continuing to keep leveraged exposures at modest levels, a cautious outlook is advised for the day.
Sector Analysis for the Coming Week
In our look at Relative Rotation Graphs®, we compared various sectors against CNX500 (NIFTY 500 Index), which represents over 95% of the free float market cap of all the stocks listed.
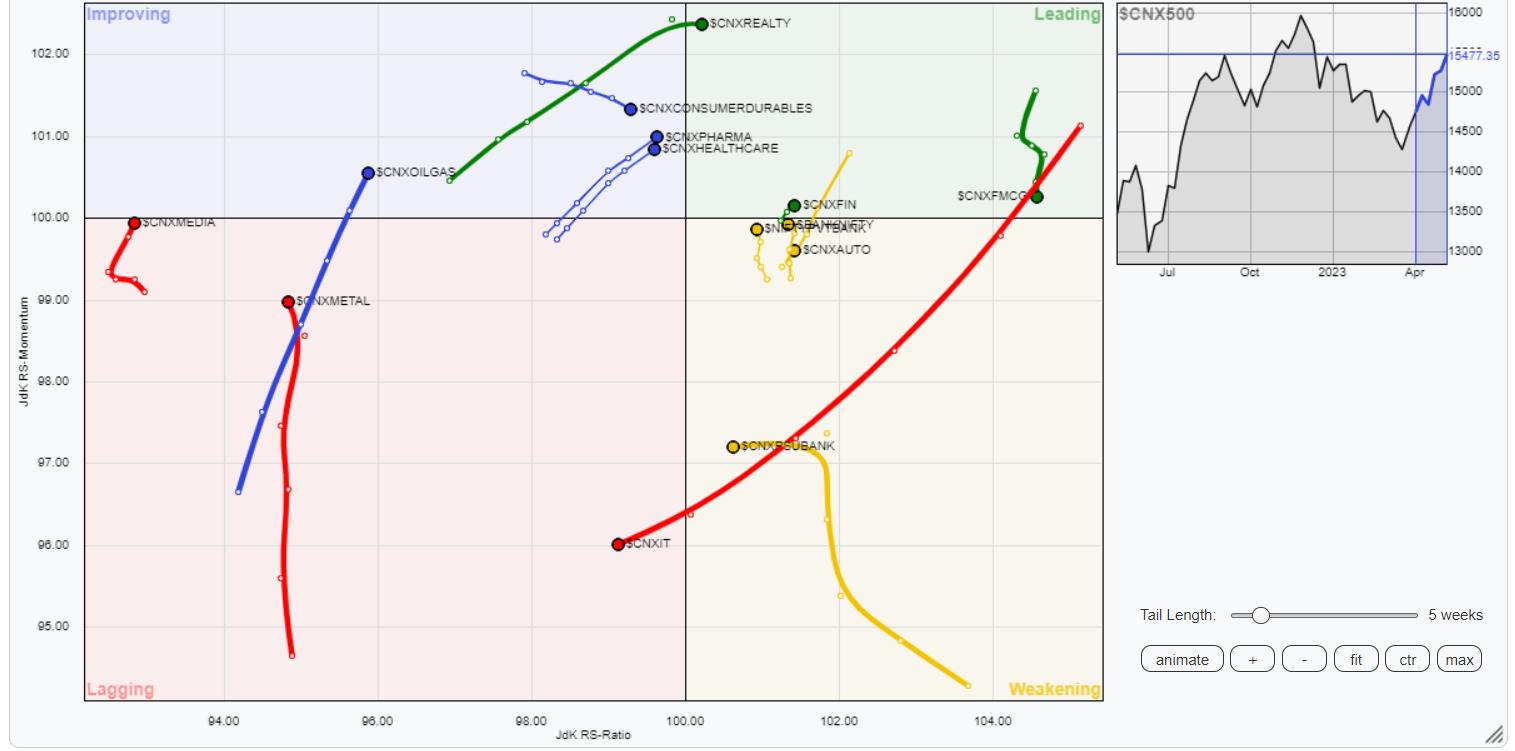
The analysis of Relative Rotation Graphs (RRG) shows that Services, Realty, Infrastructure, PSE, Midcap 100, and FMCG stay inside the leading quadrant, all except Realty Index are showing a decline in their relative momentum against the broader markets. These pockets may continue to show resilience; however, strong relative outperformance would be difficult to come in.
NIFTY Auto, BankNifty, and PSU Banks remain in the weakening quadrant; they continue to show improvement in their relative momentum against the broader NIFTY 500 Index.
The NIFTY IT Index has rolled inside the lagging quadrant. It is likely to relatively underperform the markets. The Metal and Media Indices are inside the lagging quadrant and are showing improvement in their relative momentum, but the performance of the Metal space may be adversely affected by an up-move in the US Dollar Index.
The Energy Index is seen firmly placed inside the improving quadrant along with the Consumption and Pharma Index. These pockets may show resilient performance against the broader markets.
Important Note: RRG™ charts show the relative strength and momentum of a group of stocks. In the above Chart, they show relative performance against NIFTY500 Index (Broader Markets) and should not be used directly as buy or sell signals.
Milan Vaishnav, CMT, MSTA
Consulting Technical Analyst
www.EquityResearch.asia | www.ChartWizard.ae


