After a strong performance in the week before this one, the markets chose to take a breather. The NIFTY went within the kissing distance of the all-time high level of 18887 and saw corrective pressures at that point. The markets kept on testing these crucial levels multiple times while the Banknifty (Nifty Bank Index) grossly underperformed the NIFTY on relative terms. The index oscillated in a narrow 239.50 points range over the past five sessions but ended up delaying the much-awaited breakout. The headline index closed with a net loss of 160.50 points (-0.85%) on a weekly basis.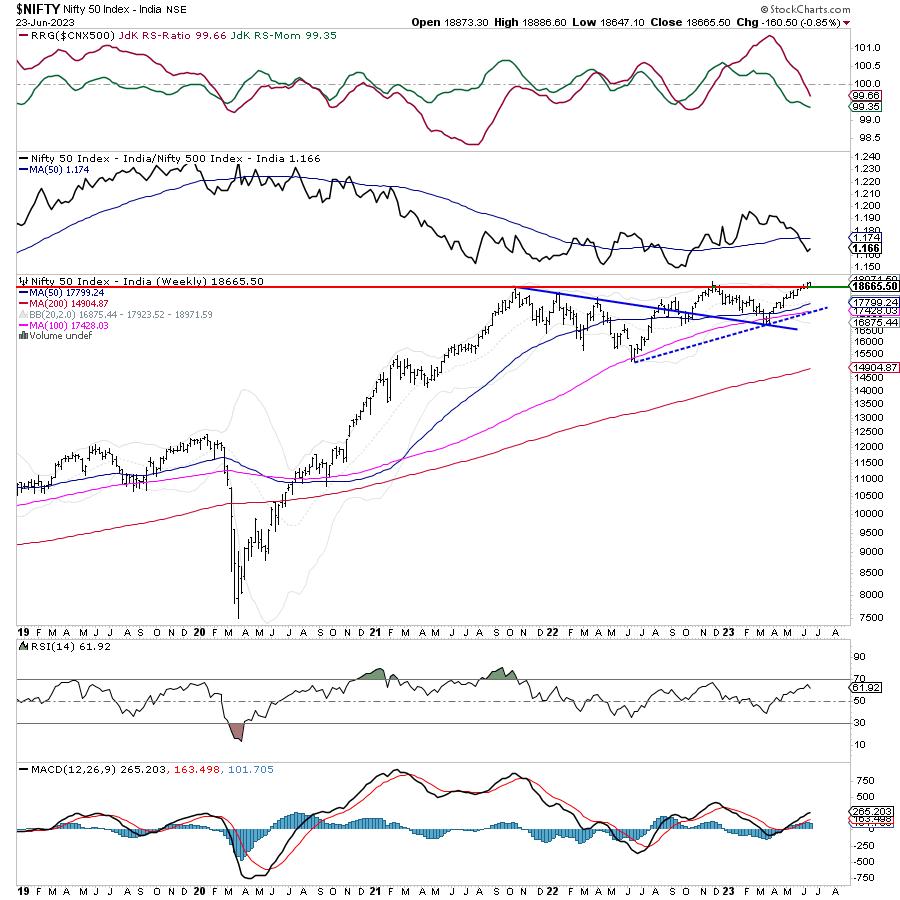
While the markets test and retest their tops, we need to take a look at the factors that are not allowing a clean breakout to happen. First and foremost, the market internals, i.e., the market breadth. The breadth is not as strong as it should be; we would need a much stronger market breadth than what we have right now to first get such major breakouts and then sustain them. Then comes VIX which continues to remain at one of its lowest levels. These levels continue to leave the markets vulnerable to profit-taking bouts. And then comes the lack of participation and relative underperformance of the banking and financial space. For the NIFTY to get any major and sustainable breakouts, these three things need to get corrected.
The coming week is a truncated one; Wednesday is a trading holiday on account of Bakri Id. Expect a tepid start to the week; the levels of 18800 and 18950 are likely to act as resistance points. Supports come in at 18550 and 18465 levels.
The weekly RSI is 61.92; it stays neutral and does not show any divergence against the price. Weekly MACD stays above the signal line.
The pattern analysis of the weekly charts shows that the NIFTY has formed a classical top by going within the kissing distance of the previous high point. However, it is now also showing some improvement in its relative performance against the broader markets. It continues to stay above key moving averages; the chart patterns suggest that the markets may continue staying in a defined range for some time. It will have to keep its head above 18550 levels to avoid any incremental weakness.
All in all, the coming week will be truncated due to a trading holiday in between, the markets will need to be approached on a highly selective note. Unless a clean breakout is achieved, all fresh purchases must be kept not only selective but also a bit defensive in nature. The lack of a strong market breadth and low VIX levels is something that one should not ignore; this levels the markets vulnerable to profit-taking bouts at higher levels. It is strongly recommended to continue vigilantly protecting profits at higher levels. A cautious outlook is advised for the coming week.
Sector Analysis for the coming week
In our look at Relative Rotation Graphs®, we compared various sectors against CNX500 (NIFTY 500 Index), which represents over 95% of the free float market cap of all the stocks listed.
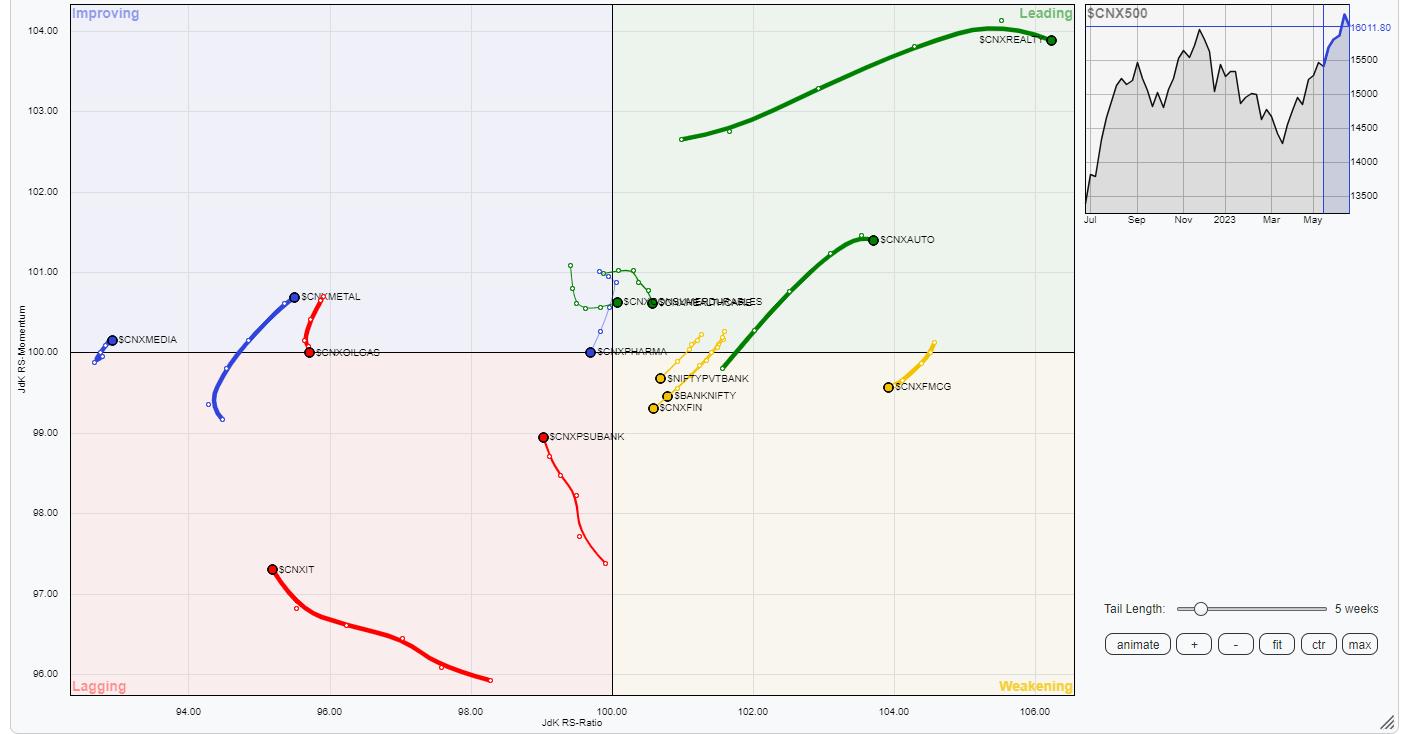
The analysis of Relative Rotation Graphs (RRG) does not show any major change in the sectoral setup to what it was in the previous week. NIFTY Auto, Consumption, Midcap 100, and Realty indices continue to remain inside the leading quadrant. We will continue seeing these groups relatively outperforming the broader NIFTY 500 index.
NIFTY FMCG, Financial Services, Banknifty, Infrastructure, and PSE sectors also remain inside the weakening quadrant. Individual shows from the components of these groups are likely but they may continue to show weak relative performance.
The PSU Bank index is inside the lagging quadrant. However, it shows improvement in its relative momentum against the broader markets. NIFTY IT too is seeing some improvement in the relative momentum against the broader markets. The Pharma index is on the verge of rolling back inside the lagging quadrant.
NIFTY Metal, Energy, and Media indices are inside the improving quadrant.
Important Note: RRG™ charts show the relative strength and momentum of a group of stocks. In the above Chart, they show relative performance against NIFTY500 Index (Broader Markets) and should not be used directly as buy or sell signals.
Milan Vaishnav, CMT, MSTA
Consulting Technical Analyst
www.EquityResearch.asia | www.ChartWizard.ae


