This was the second week in a row where the markets delayed their breakout and continued to flirt with the key levels. This time, they continued to stay largely in a defined range and resist the key levels. The NIFTY50 index remained above the crucial supports; at the same time, it also failed to break above the important resistance zone. The trading range also remained narrow; the index oscillated in a 246.30-point range before closing on a flat note. While keeping completely devoid of any directional bias, the headline index closed with a marginal gain of 29.30 points (+0.16%) on a weekly basis.
From a technical perspective, two things are delaying the otherwise imminent breakout. The first is the not-so-strong market breadth. We would generally need much stronger market breadth for any significant breakout to first occur, and then to sustain itself. The other thing that warrants caution is the very low level of INDIAVIX. The VIX is at one of its lowest levels seen only during the pre-pandemic days. The low levels of VIX leave the market vulnerable to volatile profit-taking bouts at higher levels. The market will have to correct both of these factors before it can experience a major breakout. If the breakout takes place in the present technical conditions, we might be in for a questionable rally in the markets.
All eyes will be on the FOMC meeting outcome; the Fed is expected to pause after eleven consecutive rate hikes. While a quiet start is anticipated for the week, the levels of 18680 and 18885 are expected to act as resistance for the markets. The supports are likely to come in at 18480 and 18365 levels.
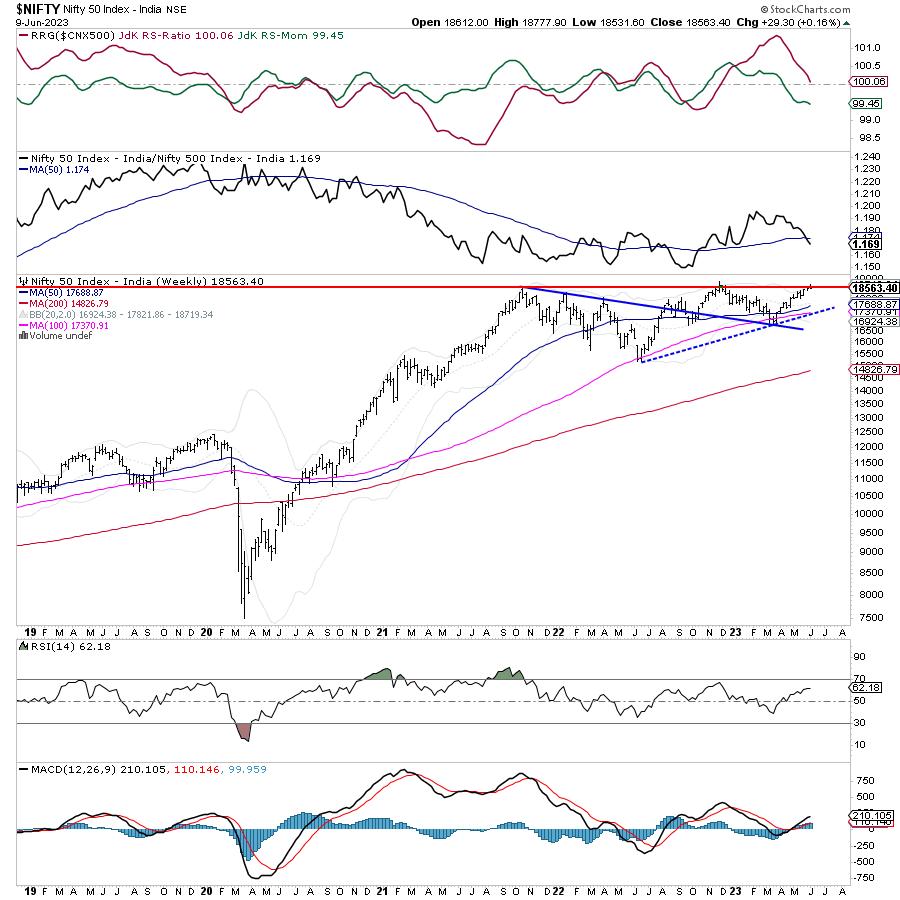
The weekly RSI is 62.18; it remains neutral and does not show any divergence against the price. The weekly MACD is bullish and still above the signal line.
The pattern analysis shows that the NIFTY has a resistance zone of 18650-18750 to navigate before it stages a breakout. However, no sustainable up move is likely so long as NIFTY is below this zone. In the same way, any slip below 18600 levels will push the markets under some prolonged consolidation once again.
All in all, in the event of any up move, we will need to keep a close eye on the market breadth. The strength of the rally will be very important, as that would determine where it is attempting a breakout. Besides this, the low levels of VIX also should not be overlooked, as they keeps the market vulnerable to profit-taking from higher levels. It is recommended to continue approaching the markets in a very selective way and protect profits vigilantly at higher levels. A cautious approach is advised for the coming week.
Sector Analysis for the Coming Week
In our look at Relative Rotation Graphs®, we compared various sectors against CNX500 (NIFTY 500 Index), which represents over 95% of the free float market cap of all the stocks listed.
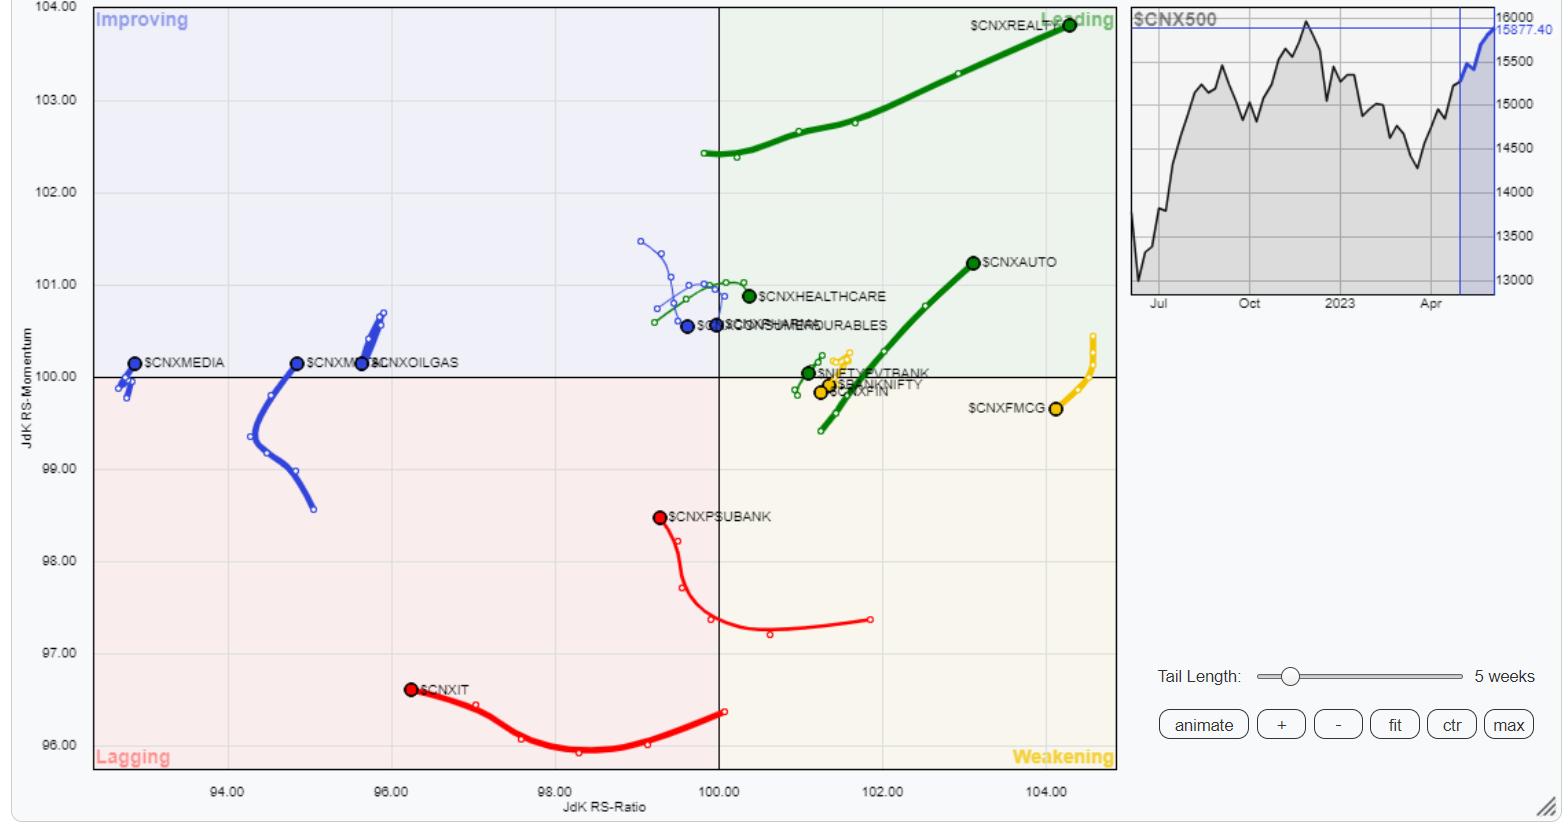
The analysis of Relative Rotation Graphs (RRG) shows the NIFTY Consumption, Auto, and MidCap 100 indices are inside the leading quadrant, and these groups can relatively outperform the broader markets.
The Nifty Financial Services and BankNifty have rolled inside the weakening quadrant. Besides this, the Infrastructure, PSE, and FMCG indices are also inside the weakening quadrant.
The IT index continues to languish inside the lagging quadrant. The Commodities, PSU Bank, and the Services Sector Indexes also remain inside the weakening quadrant.
The NIFTY Metal and Media sector indices have rolled inside the improving quadrant. This may lead to the beginning of a phase of relative underperformance against the broader markets. The Energy sector is also inside the improving quadrant; however, it is seen paring its relative momentum against the broader markets.
Important Note: RRG™ charts show the relative strength and momentum of a group of stocks. In the above Chart, they show relative performance against NIFTY500 Index (Broader Markets) and should not be used directly as buy or sell signals.
Milan Vaishnav, CMT, MSTA
Consulting Technical Analyst
www.EquityResearch.asia | www.ChartWizard.ae


