The markets continued their unabated upmove; following a strongly trending week, the Nifty not only ended at a fresh lifetime high point but also closed with gains for the sixth consecutive week. The markets piled up decent returns despite some signs of consolidation in the second half of the week. The last two days were choppy for the markets. However, on a weekly note, volatility, as represented by INDIA VIX remained unchanged. India Vix ended just 0.71% higher to 12.47 on a weekly basis. The trading range stayed expanded; the index oscillated in the 498.35 point range through the past five sessions. The benchmark index Nifty50 closed with a strong gain of 701.50 points (+3.46%) on a weekly basis.
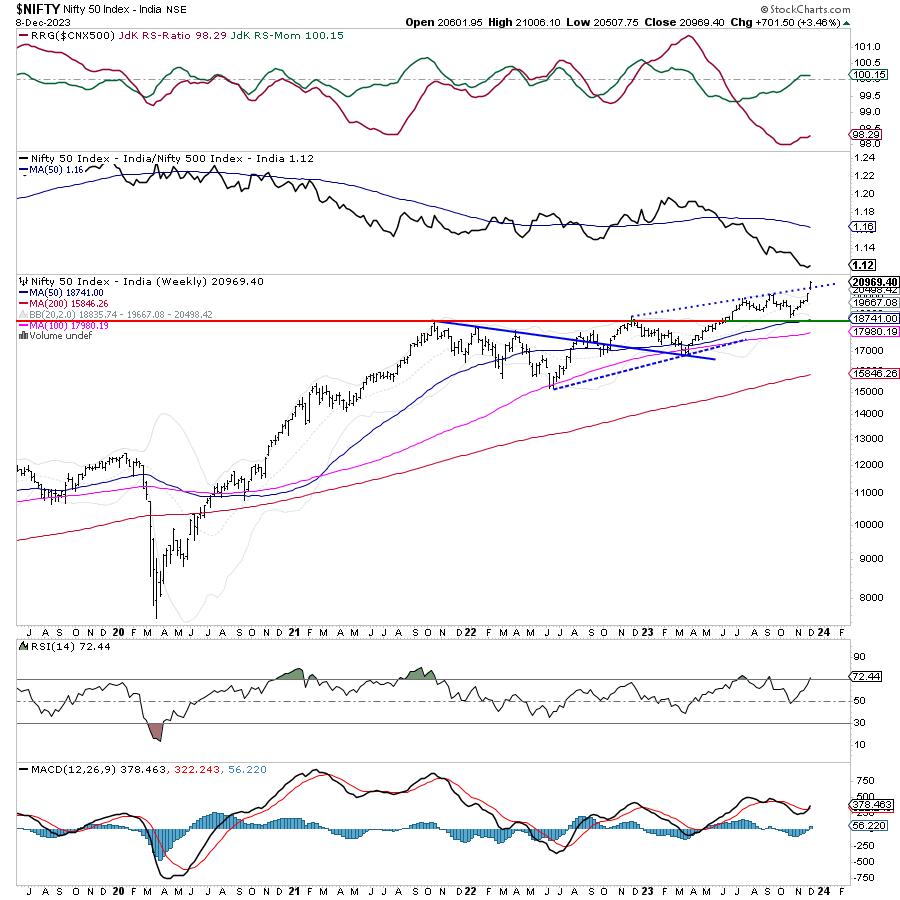
From a technical standpoint, the previous week has created a gap. In the process, the index has shifted its support zones higher in the range of 20450-20550 levels from 20000. The Nifty has also closed above its upper Bollinger band. Even if there is a temporary pullback inside the band, the markets may further their uptrend even with the possibilities of some consolidation at current levels. The behavior of the NIFTY vis-à-vis the level of 21000 is crucial. If the index is able to take this level out and stay above it, the markets will open up some more room for themselves on the upside. However, until this happens, the markets also stare at entering into a period of consolidation and take a breather after very strong moves over the past few weeks.
Monday is likely to see a quiet start; the levels of 21090 and 21265 are likely to act as potential resistance points. The supports come in at 20700 and 20580 levels. The trading range is likely to stay wider than usual.
The weekly RSI stands at 72.44; it has marked a new 14-period high which is bullish. It stays neutral and does not show any divergence against the price. The weekly MACD has shown a positive crossover; it is now bullish and trades above the signal line.
The pattern analysis of the weekly chart shows that Nifty has not only scaled a fresh lifetime high level, but it has also broken out from the rising channel with a gap. In the process, the Index has managed to drag its supports higher from 20000 levels to the 20450-20550 zone. So long as the index keeps its head above this zone, the breakout and trend will remain intact.
The closing of the Index above the upper Bollinger band has fortified the chances of it moving higher; however, given the kind of runup the Nifty has seen, it has gone a bit ahead of the curve. In this case, with 21000 not taken out, we may see the markets slipping into some ranged consolidation.
All in all, this is the time when one needs to get defensive and cautious. Protecting gains at current levels is of paramount importance. While fresh purchases can be made highly selectively, emphasis should also be placed on protecting profits at current and higher levels. The defensive pockets like FMCG, IT, PSE, etc., may continue to find traction over the coming days. While getting extremely selective with new purchases, profits must be guarded at higher levels.
Sector Analysis for the coming week
In our look at Relative Rotation Graphs®, we compared various sectors against CNX500 (NIFTY 500 Index), which represents over 95% of the free float market cap of all the stocks listed.
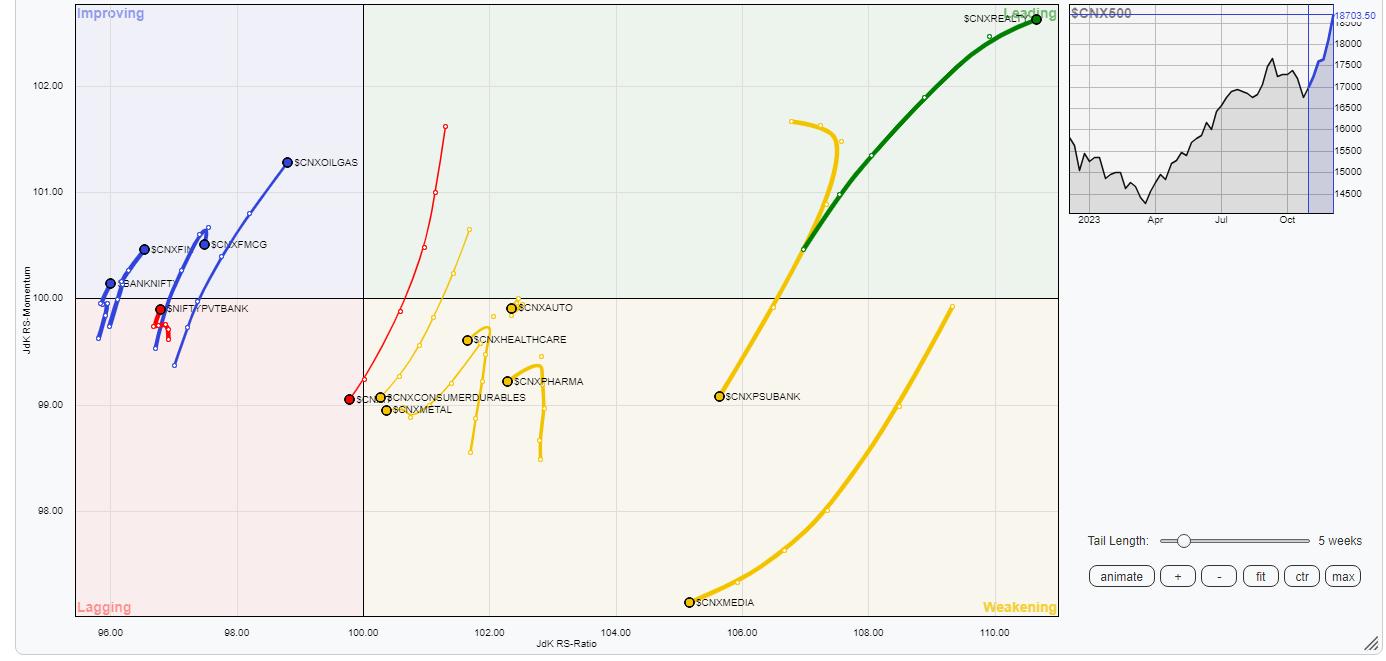 Relative Rotation Graphs (RRG) show that the Nifty Realty, PSE, Infrastructure, Energy, and Commodities indices are inside the leading quadrant. These groups are likely to relatively outperform the broader Nifty 500 index over the coming week.
The Nifty Auto Index which was in the weakening quadrant is seen paring its momentum. Also, the Midcap100, PSU Bank, Media, Pharma, and the Metal index continue to drift inside the weakening quadrant. Isolated stock-specific shows may be seen from these groups but overall they may get slower in terms of relative performance.
The NIFTY IT Index has rolled inside the lagging quadrant. It may now relatively underperform the broader markets.
The Nifty Bank index has finally rolled inside the improving quadrant. This may lead to the end of this sector's relative underperformance. Besides this, the Consumption, FMCG, Financial Services, and Services sector indices are also inside the improving quadrant.
Important Note: RRG™ charts show the relative strength and momentum of a group of stocks. In the above Chart, they show relative performance against NIFTY500 Index (Broader Markets) and should not be used directly as buy or sell signals.
Milan Vaishnav, CMT, MSTA
Consulting Technical Analyst
www.EquityResearch.asia | www.ChartWizard.ae


