The equity markets have ended the year on a very strong note.
As the week comes to a close, we not only end the month, but also the year. On a monthly basis, the NIFTY has had a stellar run this December, having gained 1598 points (+7.94%). On a YTD basis, NIFTY has been the fourth-best Index, as it returned 19.68% on a year-to-date basis. For comparison, Nasdaq gained 44.33%, while S&P 500 index returned 30.42% over the same period. The week remained a trending one except for the last trading day of the week, when the markets consolidated. Over the past four days, the Index oscillated in a 472-point range before closing the week with a net gain of 382 points (+1.79%).
If we take a sectoral look, the Realty Index performed best, as it returned 79.56%. This was followed by PSE,and Auto Indices, which returned 77.36% and 46.97% respectively over the same period. While the worst annual performance was from the Nifty Services Sector Index, which returned 11.09%, it was BankNifty that grossly underperformed and returned a slightly better return at 12.28%. Speaking of this past week, volatility spiked. INDIAVIX surged by 5.80% to 14.50 levels, despite coming off from its weekly highs.
The markets are likely to step into the new year on a quiet note. Consolidation might continue as the first weekly options expiry data define the 22000-21500 range for the Index. The NIFTY is likely to see levels of 21850 and 22000 acting as resistance points. The supports come in at 21500 and 21360.
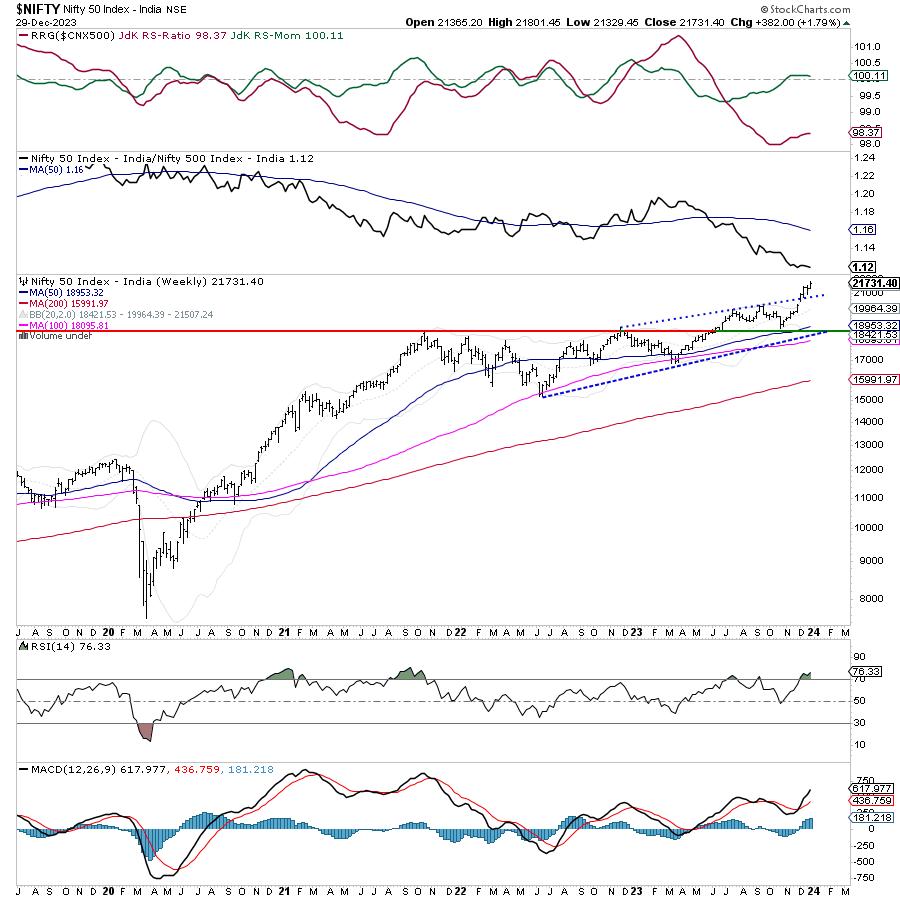
The weekly RSI is 76.33. While it has marked a new 14-period high and remains overbought, it is also still neutral while not showing any divergence against the price. The weekly MACD continues to be bullish and remains above its signal line.
The pattern analysis of the weekly charts shows that the breakout that Nifty achieved from the rising channel when it crossed 20800 levels remains very much intact. However, it can also be observed that the markets have deviated much away from the mean. The fastest 20-week MA is at 19964, which is 1761 points below the current levels. The 50-period MA stands 2778 below current levels. This shows that the markets have run ahead of their curve and stand overextended on the charts. The slightest of the mean-reversion can lead to some corrective retracement in the markets.
Unless the previous high point of 21801 is convincingly taken out, the markets may have put a temporary top in place for themselves. Even if the markets attempt to post incremental highs, they have created a stiff resistance zone in the 21800-22000 zone. It would be greatly difficult for the market to move past the 22000 level anytime soon and sustain above it. The most prudent method to navigate such overheated markets would be to keep leveraged exposures at modest levels and stock to only those stocks that show strong, or at least improving, relative strength. It is strongly recommended that one must now turn to traditionally defensive pockets like Pharma, FMCG, etc. while making fresh purchases. A highly selective and stock-specific approach is advised for the coming week.
Sector Analysis for the Coming Week
In our look at Relative Rotation Graphs®, we compared various sectors against CNX500 (NIFTY 500 Index), which represents over 95% of the free float market cap of all the stocks listed.
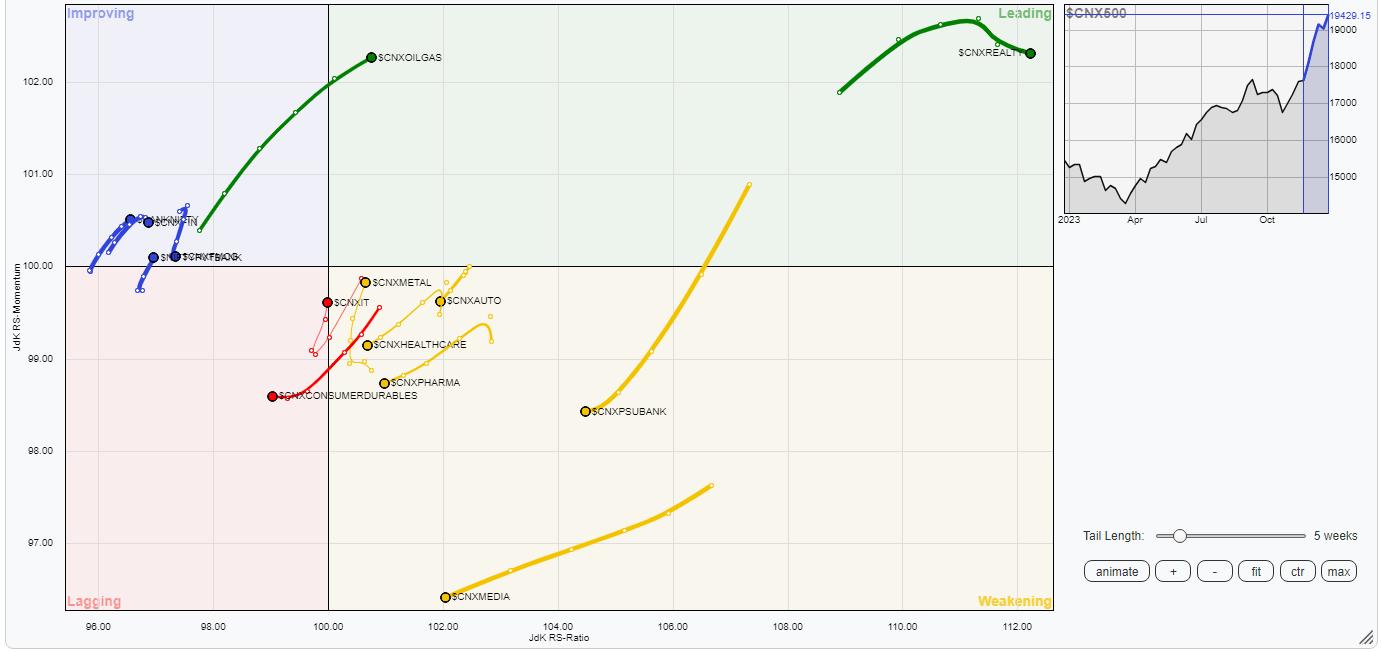
Relative Rotation Graphs (RRG) continue to show mixed setups. The NIFTY Energy, PSE, Realty, Infrastructure, and commodities are inside the leading quadrant. These sectors are likely to relatively outperform the broader markets.
The NIFTY Pharma, PSU Banks, Media, Auto, and Midcap 100 indices are inside the weakening quadrant. The Metal index is inside the weakening quadrant quadrant as well, but it can be seen improving on its relative momentum.
While staying inside the lagging quadrant, the Nifty IT Index is also showing sharp improvement in its relative momentum against the broader markets.
The Nifty FMCG, Services Sector, BankNifty, and Financial Services Indices are inside the improving quadrant.
Important Note: RRG™ charts show the relative strength and momentum of a group of stocks. In the above chart, they show relative performance against NIFTY500 Index (Broader Markets) and should not be used directly as buy or sell signals.
Milan Vaishnav, CMT, MSTA
Consulting Technical Analyst
www.EquityResearch.asia | www.ChartWizard.ae


