In the previous technical note, it was categorically mentioned that, while the overall trend may stay intact, the markets could continue to largely consolidate. In line with the analysis, the markets kept consolidating, staying in a broad but defined trading range. That range, over the past week, was 422 points; the NIFTY oscillated in this range before closing the week with gains. The volatility continued to retrace; the headline index closed with a net weekly gain of 172 points (+0.78%).
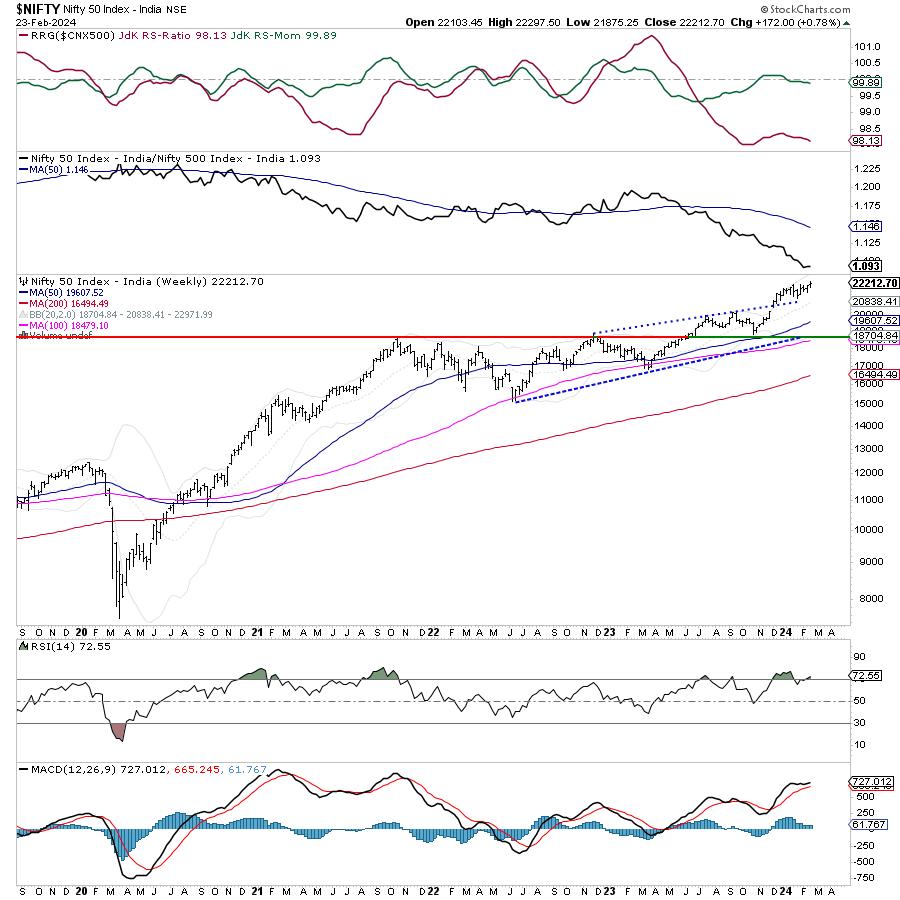
Volatility also continued to taper down mildly. INDIAVIX came off by a modest 1.64% to 14.97. From a technical perspective, the markets remained in a range. The present technical structure suggests that even if the markets move higher and post incremental highs, any runaway move may take some time to happen. On the lower end, it has dragged its support higher to 21700, which keeps the NIFTY in the defined 700-point trading range. Going by the Options data, unless 22500 is not comprehensively taken out, any runaway sustained uptrend is unlikely, and the markets will continue to find profit-taking pressure at higher levels.
The coming week is the expiry week for the monthly derivative series; the moves may stay influenced by expiry-centric activities. While a stable start to the week is expected, Nifty may find resistance at the 22300 and 22470 levels. The supports come in at the 22000 and 21800 levels.
The weekly RSI stands at 72.55; it stays mildly overbought. The RSI remains neutral and does not show any divergence against the price. The weekly MACD is bullish and above the signal line. The histogram is narrowing, which suggests the momentum in the upmove may be decelerating.
Going by the pattern analysis, the channel breakout that the NIFTY achieved as it crossed above 20800 remains very much intact and in force. Presently, the index can be seen consolidating at higher levels while it keeps marking incremental highs. In the process, the supports for NIFTY have been dragged higher to 21700 levels; any corrective moves are expected to find support. The bands have gotten wider than usual; this suggests that, while the Index may continue marking incremental highs, it may take some time before it makes any runaway upmove.
All in all, while the undercurrent remains buoyant and intact, there is an increased possibility of the NIFTY continuing to consolidate at higher levels. It is time that one gets highly stock-specific in the approach. Also, with any incremental moves higher, emphasis should be placed on protecting higher-level profits. Fresh purchases should be made in a highly selective manner. Volatility is expected to rise from its current levels. A cautious and mindful approach is advised for the coming week.
Sector Analysis for the Coming Week
In our look at Relative Rotation Graphs®, we compared various sectors against CNX500 (NIFTY 500 Index), which represents over 95% of the free float market cap of all the stocks listed.
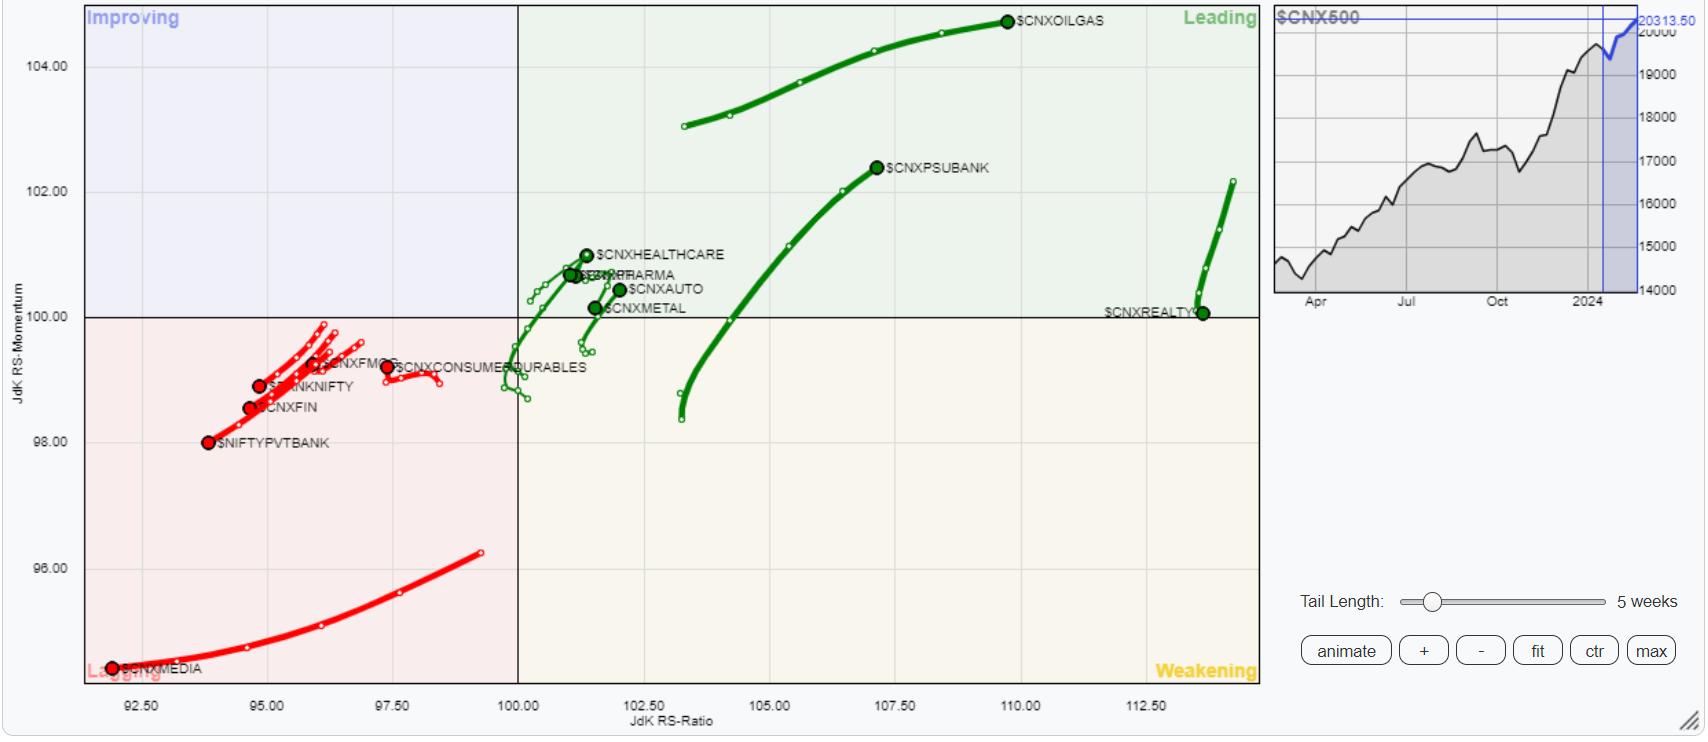
Relative Rotation Graphs (RRG) show that the Nifty Pharma and Auto indices have rolled inside the leading quadrant. Besides this, the Nifty Energy, Realty, IT, Infrastructure, Metal, and PSU Bank indices are also inside the leading quadrant. These groups shall continue to relatively outperform the broader NIFTY 500 index.
The Nifty Midcap 100 index stays inside the weakening quadrant.
The Nifty FMCG and Consumption indices are inside the lagging quadrant; however, they can be seen improving on their relative momentum against the broader markets. Besides this, the Nifty Financial Services, Services Sector, BankNifty, and the Media index continue to languish inside the lagging quadrant. These four groups may continue to relatively underperform the broader markets.
There are no indices present inside the improving quadrant.
Important Note: RRG™ charts show the relative strength and momentum of a group of stocks. In the above Chart, they show relative performance against NIFTY500 Index (Broader Markets) and should not be used directly as buy or sell signals.
Milan Vaishnav, CMT, MSTA
Consulting Technical Analyst
www.EquityResearch.asia | www.ChartWizard.ae


