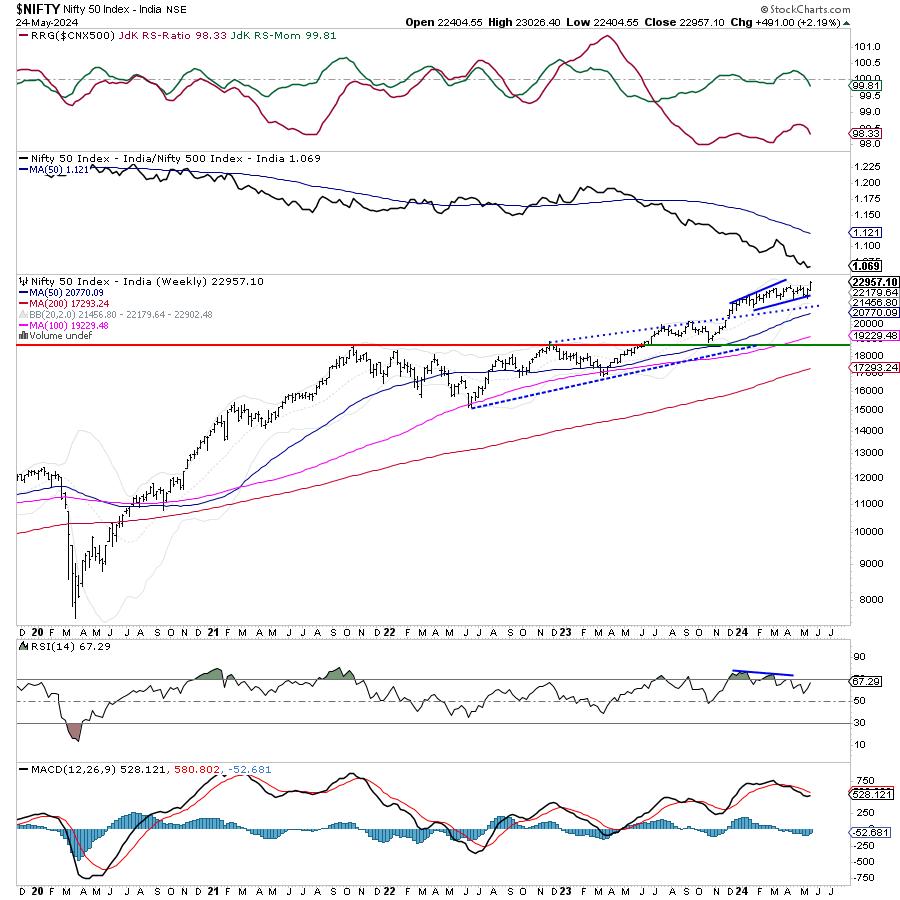
It was a truncated day for the markets; over the past four trading sessions, the Indian equities continued to edge higher and ended on a fresh lifetime high. The volatility, too, remained at elevated levels. As mentioned in the previous technical note, the markets are building up ahead of the General Election results on June 4th; this is one of the major external events that affect the markets. Over the past four sessions, the Nifty has maintained a buoyant trajectory; it oscillated in a 621.85-point range. Volatility has also continued spiking higher; IndiaVIX surged by another 9.66% to 21.71. Following a strongly trending week, the headline index closed with a net weekly gain of 491 points (+2.19%).
Over the past weeks, we have seen the Nifty and the VIX rising simultaneously. Past instances have shown that such a phenomenon often ends up acting as a precursor to an impending corrective move. As we head into the expiry of the current month's derivative series, Nifty has built up fresh OI at 23000 and 23500 levels on the upside. On the lower side, 22500 has been seen building support as per the options data. The derivatives data show that the Nifty is gearing up for a volatile move on either side while it navigates the election outcome.
The coming week may see a stable start to the trade; the levels of 23200 and 23350 are likely to act as immediate resistance levels. The supports come in at 22700 and 23550 levels.
The weekly RSI is 67.29; it shows a mild bearish divergence against the price. The weekly MACD is bearish and trades below its signal line. A strong white-bodied candle shows a buoyant trend that existed throughout the week.
The pattern analysis of the weekly chart continues to show Nifty staying in a small rising channel; however, the nearest support, in the form of a 20-week MA, exists way below at 22179. The slightest of the corrective bout has got significant downsides from the current levels. The 50-DMA is placed at 22342. So on a broader note, the immediate support zone for the Index exists at 22150-22350 levels. While the markets may remain in a broad range so long as they are above this zone, any violation of this support zone with inflict technical damage on the charts.
Overall, as we navigate the coming monthly derivatives expiry week and the general election outcome after that, it will be extremely important to prepare for the volatility that we are set to witness in the markets. It would be prudent to curtail leveraged exposures. Fresh buying should be kept limited to defensive and low-beta stocks; exposures in stocks with either strong or improving relative strength would be an added advantage. A very cautious approach is advised in the coming week, with an emphasis on enforcing strict protective stops and opting for hedges wherever possible.
Sector Analysis for the Coming Week
In our look at Relative Rotation Graphs®, we compared various sectors against CNX500 (NIFTY 500 Index), which represents over 95% of the free float market cap of all the stocks listed.
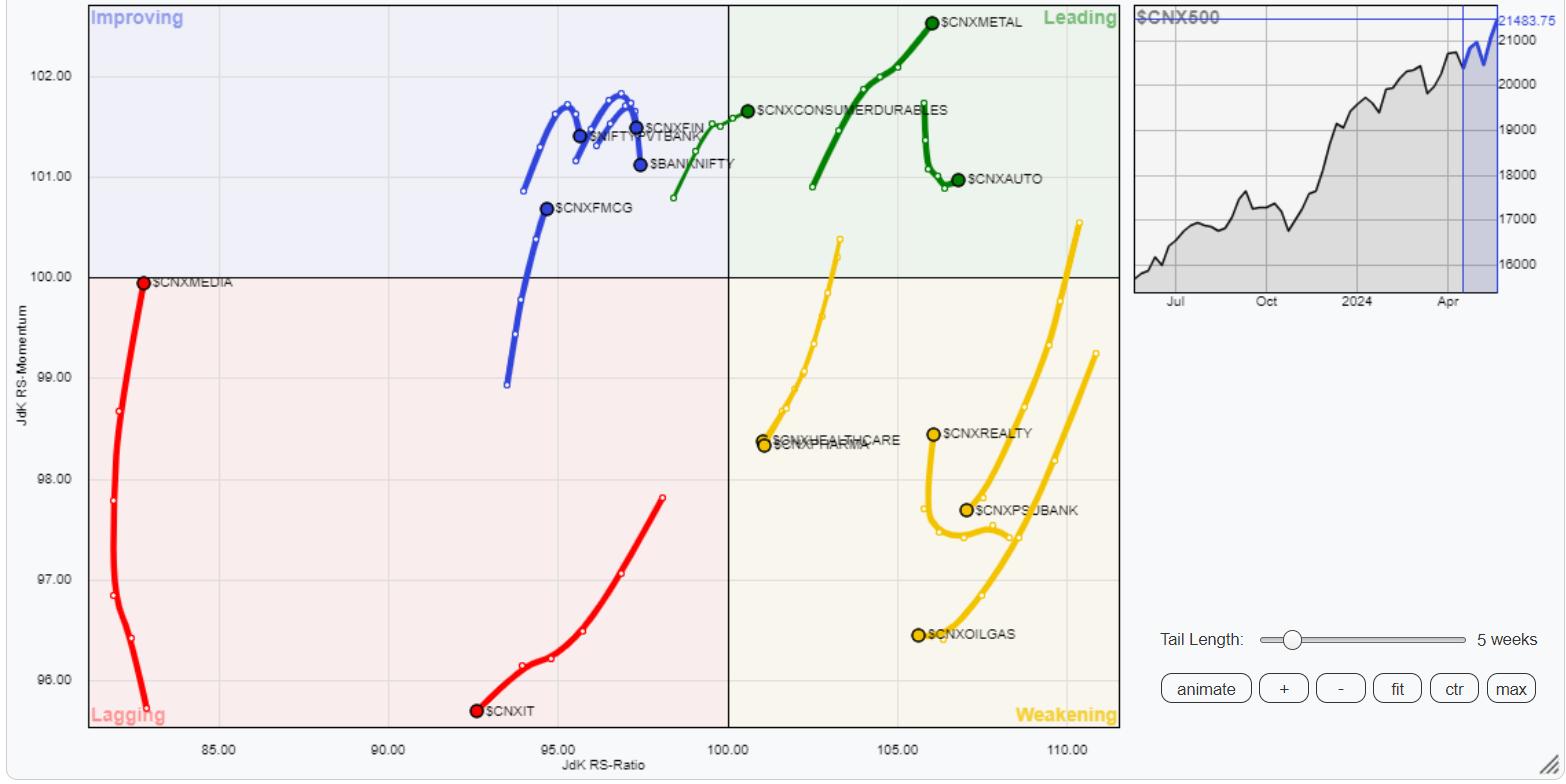
Relative Rotation Graphs (RRG) show that the Nifty Auto, Consumption, and Metal Index remain inside the leading quadrant. These groups are likely to continue to relatively outperform the broader markets.
While staying inside the weakening quadrant, both Realty and PSE indices are showing improvement in their relative momentum against the broader markets, along with the Commodities and Midcap 100 index. Besides this, the PSU Bank, Pharma, Infrastructure, and Energy index have also been placed inside the weakening quadrant.
The Nifty IT Index continues to languish inside the lagging quadrant of the RRG. It is likely to relatively underperform the broader Nifty 500 Index. The Media Index is also placed inside the lagging quadrant. However, it can be seen sharply improving its relative momentum and is on the verge of rolling inside the improving quadrant. The Nifty Services sector index has rolled back inside the lagging quadrant.
The FMCG index stays firmly placed inside the improving quadrant. The Nifty Financial Services and the Nifty Bank Index are also placed inside the improving quadrant.
Important Note: RRG™ charts show the relative strength and momentum of a group of stocks. In the above chart, they show relative performance against the NIFTY 500 Index (Broader Markets) and should not be used directly as buy or sell signals.
Milan Vaishnav, CMT, MSTA
Consulting Technical Analyst
www.EquityResearch.asia | www.ChartWizard.ae


