It was the sixth week in a row that saw the Nifty 50 index ending with gains. Over the past few days, the markets largely experienced trending days as they continued inching higher despite the intraday moves staying ranged. The Nifty also continued forming its new lifetime highs; the current week has seen the index closing at a fresh lifetime high once again. Over the past five sessions, the Nifty oscillated in a 450-point range. Volatility also modestly expanded; IndiaVix rose by 8.11% to 13.73 over the previous week. The benchmark Index also closed with a net gain of 178.30 points on a weekly note.
The coming week is truncated, with Wednesday being a trading holiday because of Moharram. The markets are in a firm uptrend; the options data suggests the potential resistance points shifting higher towards 24700-24800 levels. The 24500 level will also be a crucial level to watch, and Nifty's behavior vis-à-vis that level will dictate the index's behavior over the immediate short-term. While there is no dispute about a strong uptrend, the markets remain significantly deviated from their mean; this makes it necessary to lay an equal emphasis on guarding profits at higher levels and effectively rotating the stocks to stay invested in the ones with strong relative strength and promising technical setups.
Monday is likely to see a positive start to the day. The levels of 24650 and 24800 are likely to act as likely resistance levels for the Nifty. The supports come in lower at 24280 and 21050 levels.
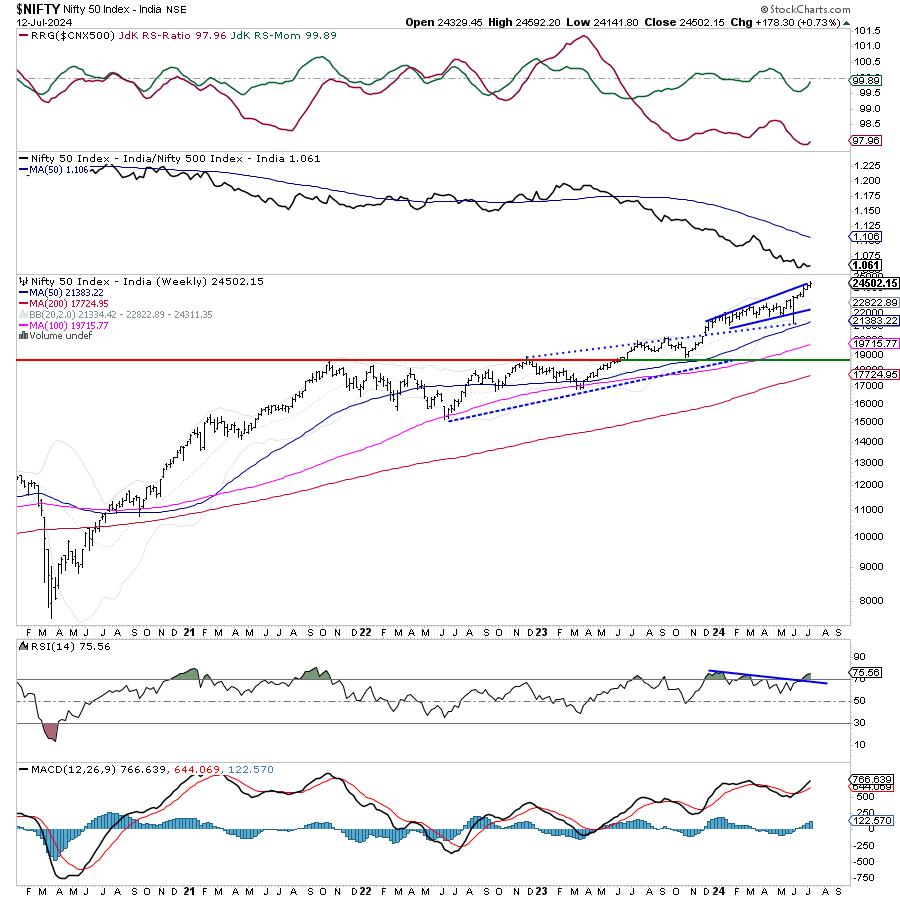
The weekly RSI is 75.86; it remains in overbought territory. It continues to be neutral and does not show any divergence against the price. The weekly MACD is bullish and is still above its signal line.
The pattern analysis of the weekly chart shows that the Nifty is significantly deviated from its mean. The nearest and fastest 20-week MA is 1680 points below the current close; the 50-week MA is 3119 points below the current close. The 20-week MA and the 50-week MA are placed at 22822 and 21383, respectively. The nearest pattern support exists at 24000 levels. Therefore, in the event of any retracement, the 24000 level provides key support; if that gets violated in the future, we will then find the markets reverting to their mean.
Overall, the markets have stayed in a firm uptrend; there are no signs whatsoever as of now that would suggest that we may see strong selling pressure. However, we can also not overlook the fact that the markets remain overextended from a technical standpoint, some ranged retracement cannot be ruled out, and it looks quite imminent. Given the present technical structure, it is of paramount importance that we vigilantly guard profits at higher levels. While keeping the leveraged exposures at modest levels, all new buying should be kept limited to the stocks seeing improved relative strength and promising technical setups. A cautious outlook is advised for the coming week.
Sector Analysis for the Coming Week
In our look at Relative Rotation Graphs®, we compared various sectors against CNX500 (NIFTY 500 Index), which represents over 95% of the free float market cap of all the stocks listed.
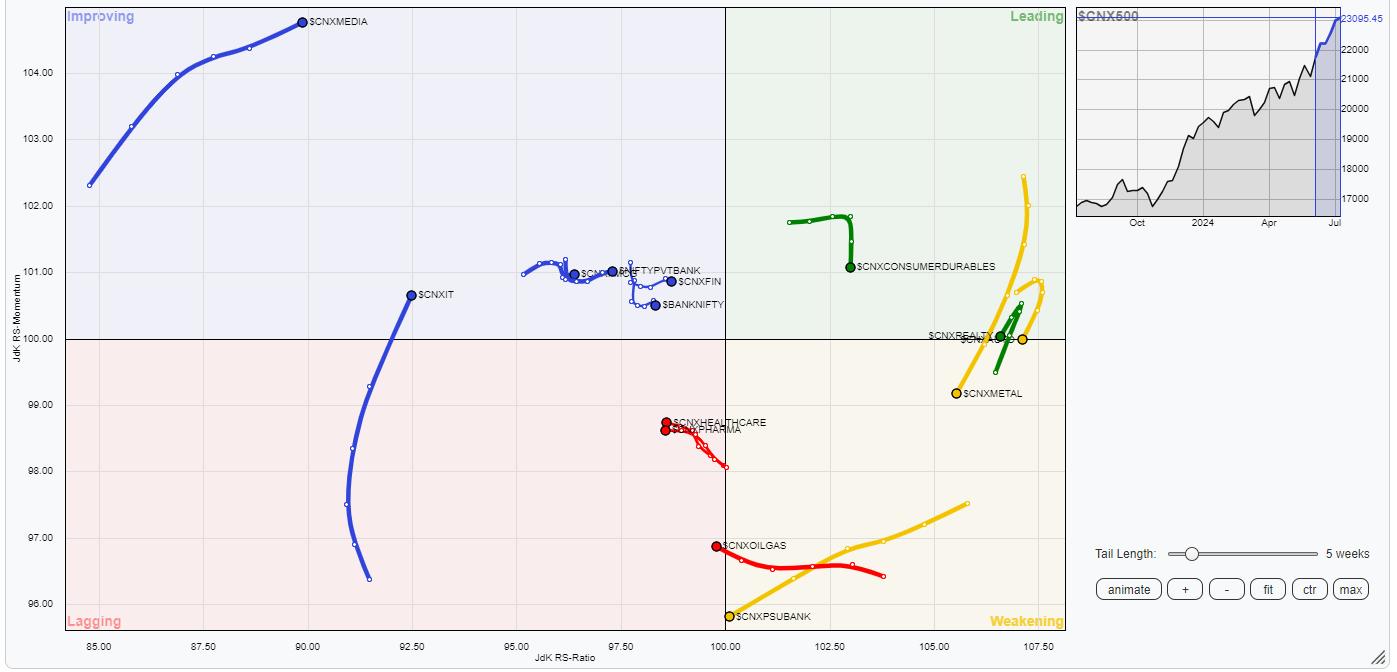
Relative Rotation Graphs (RRG) show a bit of an uncomfortable setup where there are hardly any sectors in the leading quadrant. The Nifty Midcap 50 and Nifty Realty Indices are the only two groups that are inside the leading quadrant; the Realty sector index is on the verge of rolling over into the lagging quadrant.
The Nifty Auto and Consumption Indices have rolled inside the weakening quadrant. Besides this, Infrastructure, Metal, PSE, PSUBank, and Commodities Indices are inside the weakening quadrant. These groups may continue slowing down on their relative performance against the broader markets.
The Nifty Energy Index has rolled into the weakening quadrant. The Nifty Pharma index also stays inside the weakening quadrant.
The IT index has rolled inside the improving quadrant and this marks a phase of the sector's relative outperformance against the broader markets. Besides this, the Media, FMCG, BankNifty, Services Sector, and Financial Services Indices are inside the improving quadrant.
Important Note: RRG™ charts show the relative strength and momentum of a group of stocks. In the above Chart, they show relative performance against NIFTY500 Index (Broader Markets) and should not be used directly as buy or sell signals.
Milan Vaishnav, CMT, MSTA
Consulting Technical Analyst
www.EquityResearch.asia | www.ChartWizard.ae


