 Recently, I had a very personal conversation with my fellow trader, Harvey Baraban. I asked him what he did to “warm-up” before making a trade. I already knew that we both had specific warm-up routines. His response was essentially this: “I’ll tell you my routine if you tell me yours.” As traders, we love to barter. And just as professional athletes would never ever take the field without executing their personalized warm-up routines, successful traders are very much the same. But their warm-ups are a little different in that traders ask questions instead of stretching quads. Nevertheless, they all have essential and very individualized routines.
What follows here is a unique peek into the warm-up routines of two traders in particular. These are the questions we ask before we hit the buy or sell button. In this blog, we’ve combined both of our lists of questions since we each trade in different timeframes. Every one of you should also adjust your charts to reflect your own investing horizon, but your warm-up routine should ask questions similar to the ones we pose.
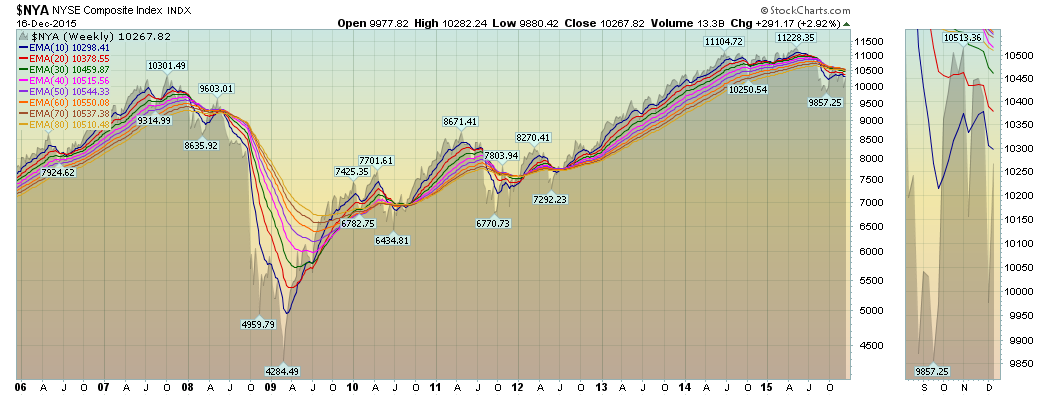
- What is the trend of the market?
The chart plots the NYSE Index overlaid by eight exponential moving averages. This is an approach that Daryl Guppy writes about a lot. The timeframe should be aligned with your personal trading timeframe.
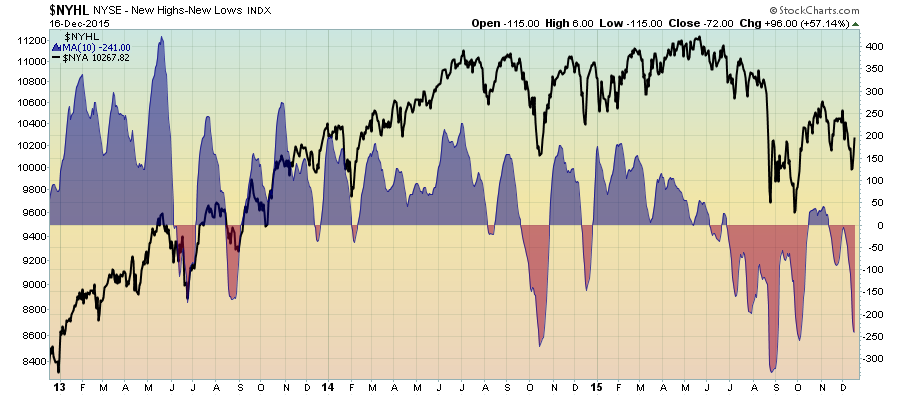
- What is the breadth of the market?
The NYSE is represented by the black line. The NYSE’s new highs minus new lows are overlaid as an area graph and represent a simple 10-day moving average of new highs minus new lows. The key to note here is the peaks and troughs for both.
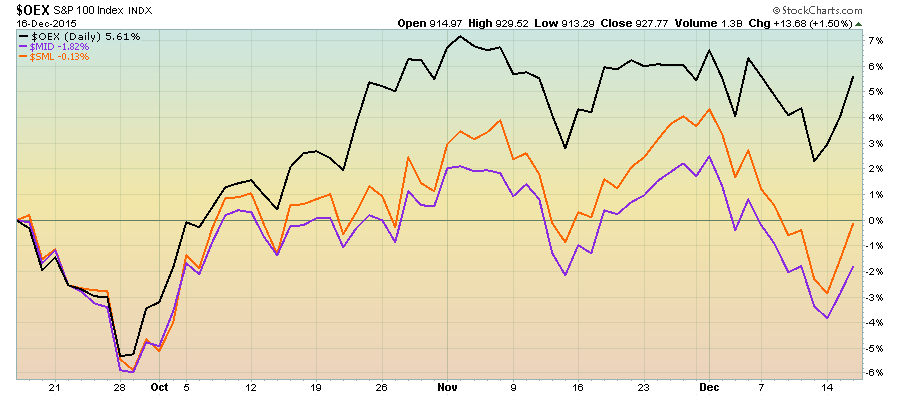
- Is the present market favoring large caps, mid-caps or small caps?
We use three indexes and plot them on a performance chart. View this in various timeframes and you clearly see, for example, that over the past three years, small caps consistently outperformed.
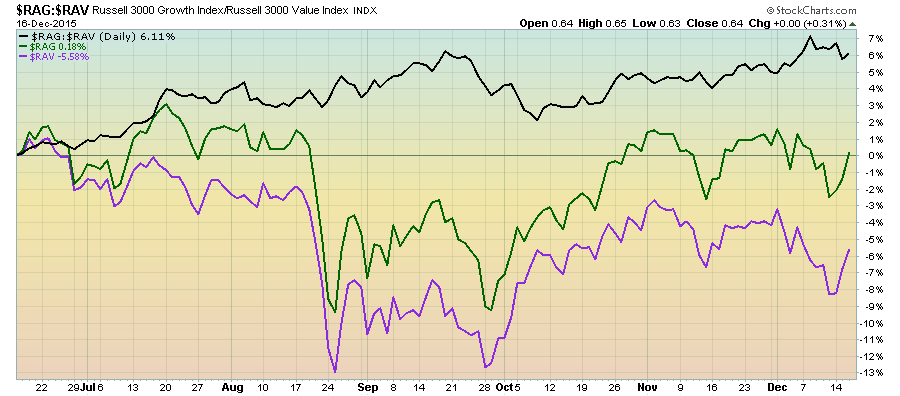
- Is the present market favoring growth stocks or value stocks?
The black line is simply a ratio of the Russell 3000 Growth Index ($RAG) which is the numerator or top number over the Russell 3000 Value Index ($RAV) which is the denominator. When the black ratio line trends up – the market is favoring growth over value and vice versa when it trends down.
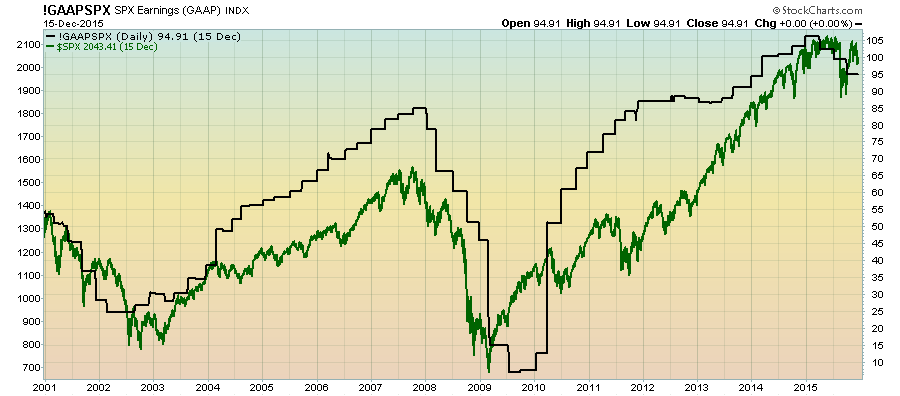
- How are S&P 500 earnings trending versus the market?
Earnings drive the stock market. If you doubt this, simply review the chart at both tops and bottoms. The stair-step graph shows as reported – trailing 12 month earnings per share for the S&P 500 which is the green line.
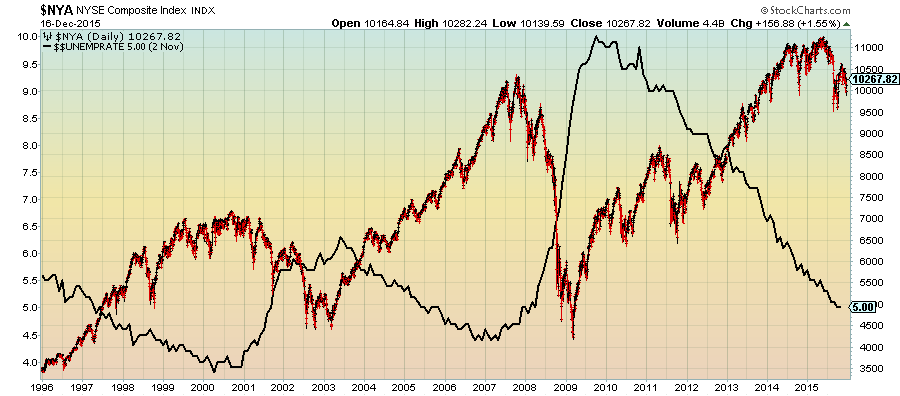
- Is the unemployment rate increasing or decreasing?
We suggest you draw some trend lines on the black line representing the unemployment rate. Take note of trend-breaks at both extremes.
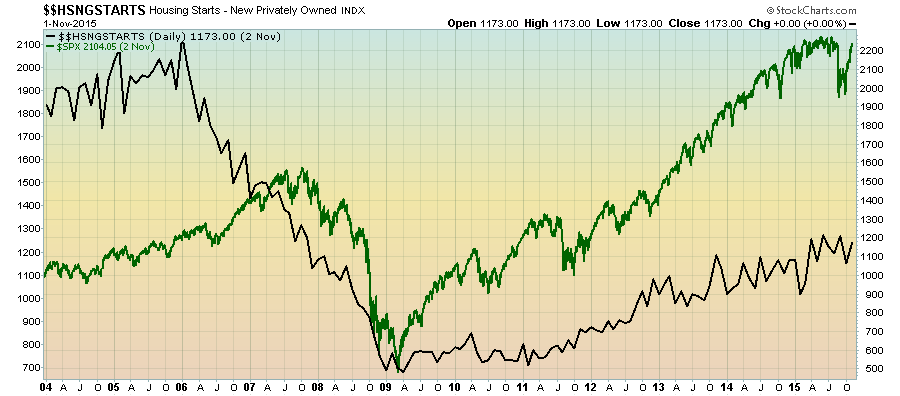
- What’s the trend of housing starts?
So much of our economy is tied in with housing that asking this question is simply prudent.
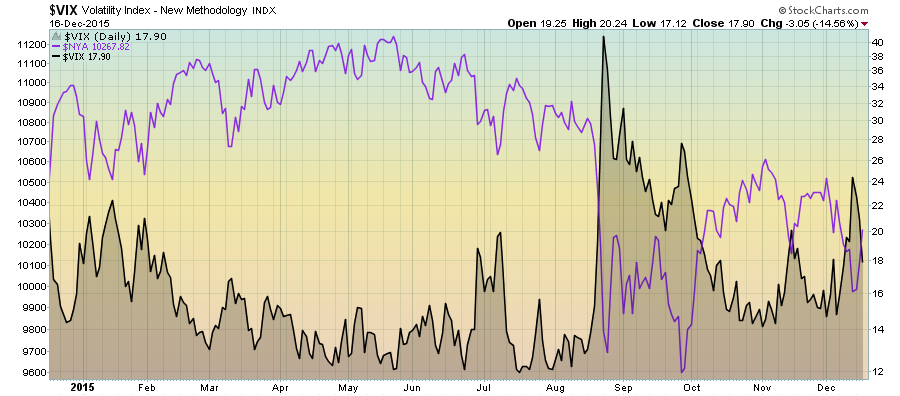
- What is the market’s fear index telling us?
$VIX is the darkened area on the chart which measures the implied volatility of S&P 500 Index Options and is expressed in percentage points which translates to something like the expected movement in the S&P over the next 30 days. It’s a sentiment indicator that’s not based on a quiz or survey but is based on actual market puts and calls. Generally, as volatility increases, markets weaken.
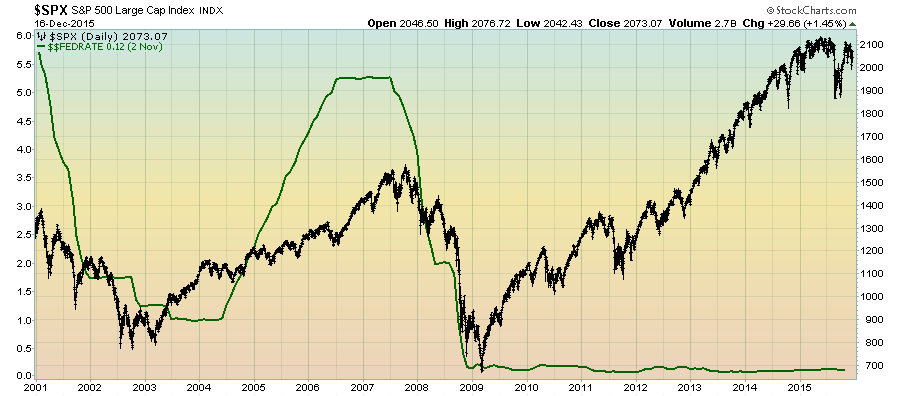
- What is the trend of the effective Federal Funds Rate?
Consider this chart in that when the Federal Reserve raises lending rates, it’s acknowledging that the economy is strong. The reverse is true when it begins to level out or decrease rates, and historically the market has reacted to this change.
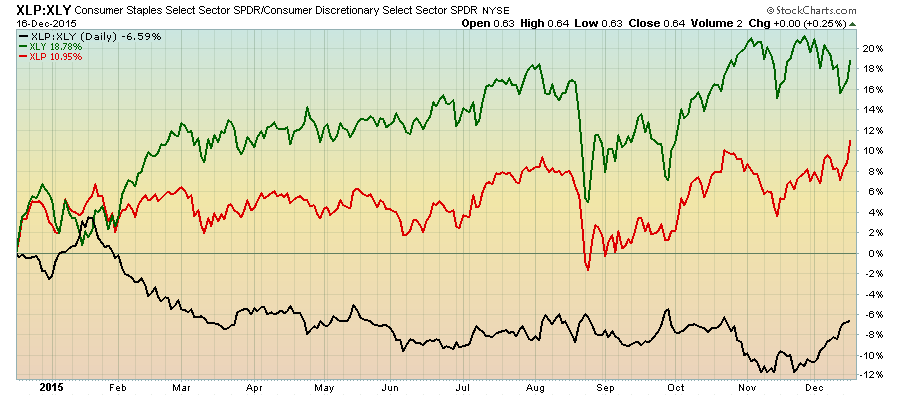
- Is the market favoring defensive stocks or cyclical stocks?
Much like what we did in answering the growth versus value question earlier, we have plotted the Consumer Staples Sector (XLP) over Consumer Discretionary Sector (XLY). If the black line is trending up, staples and defensive stocks are in favor over discretionary cyclical stocks.
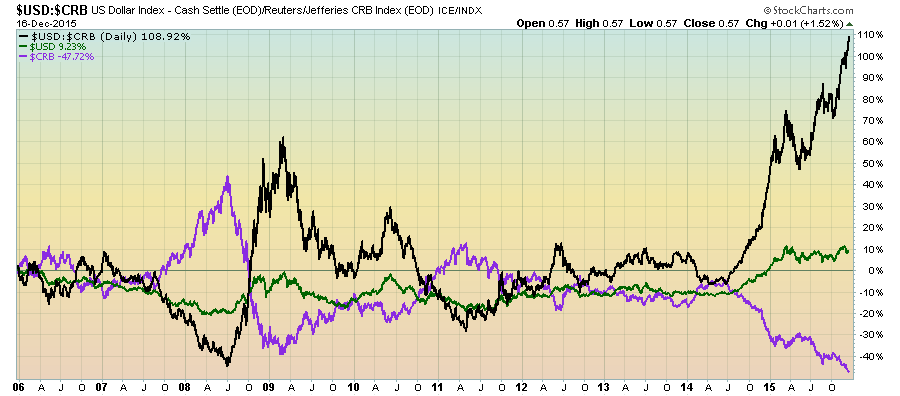
- What is happening between the U.S. dollar and commodities?
Again, the ratio is represented by the black line, and when it’s trending up, the U.S. dollar is outperforming the commodities index ($CRB). Note the obvious negative correlation historically.
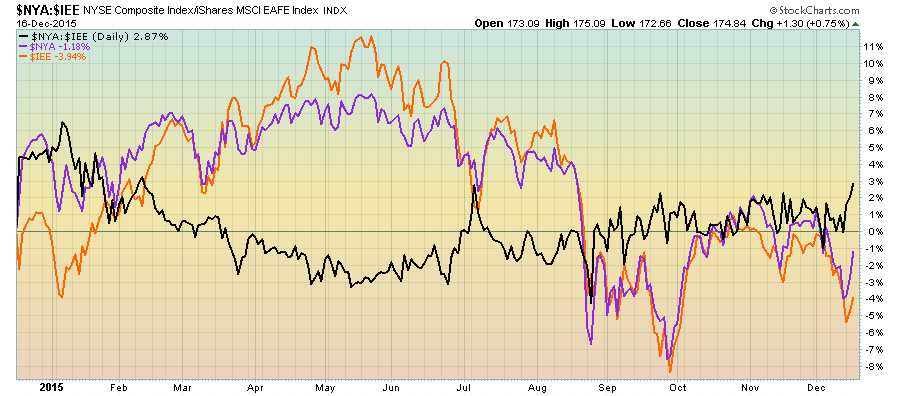
- Is the U.S. market outperforming international markets?
The ratio line (black) shows the NYSE Composite ($NYA) plotted against the EAFE Index ($IEE). These are multi-year cycles. Take a look at a 14-year chart and you’ll see that EAFE outperformed the U.S. markets for many years.
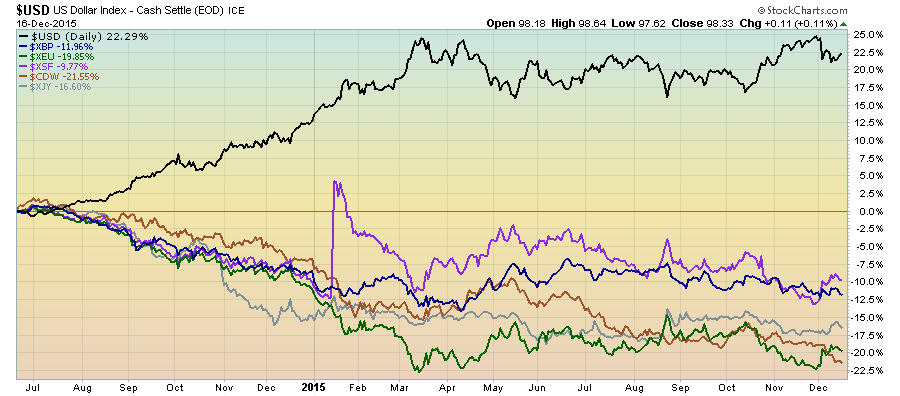
- How are key global currencies behaving?
This chart helps you decide if you want to hedge your positions.
a. $USD = U.S. Dollar
b. $XBP = British Pound
c. $XEU = Euro
d. $XSF = Swiss Franc
e. $CDW = Canadian Dollar
f. $XJY = Japanese Yen
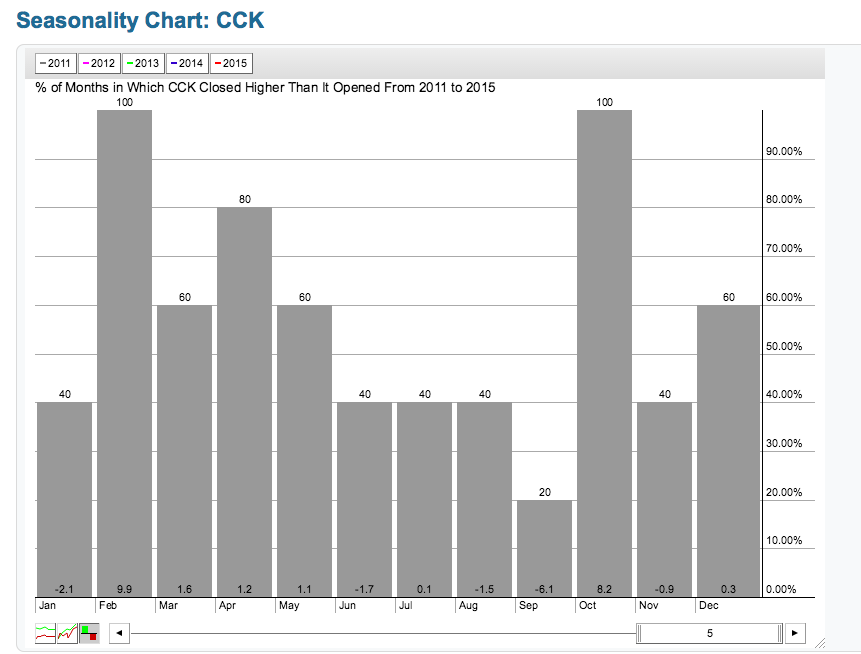
- Does the equity, ETF or mutual fund in question experience seasonal tendencies?
Here is an example: Say you are interested in buying Crown Holdings (CCK). In considering the seasonality chart, perhaps the month of September would put the probabilities on your side. Conversely, if you were selling CCK, February or October look pretty attractive. For those of you who have my Tensile Trading ChartPack, you’ll find all of these charts in the ChartList 10.5 SuperList updated on November 18, 2015.
Trade well; trade with discipline!
-- Gatis Roze, MBA, CMT
Presenter of the Tensile Trading DVD, Stock Market Mastery.
Developer of the StockCharts.com Tensile Trading ChartPack.
P.S. Click HERE for information on my future appearances & seminars.


