 You can’t download stock market wisdom. You have to experience it firsthand and practice it. In a nutshell, that is precisely what these Action Practice blogs every two weeks are all about.
The previous Action Practice (#7) presents a tool for uncovering individual investors’ tolerances for risks and rewards. The exercise was intended to identify the personal balance between fear and greed with which investors participate in the market. The response was so positive and encouraging that I actually wrote an entire blog last week to dive into the material in greater depth. Please review that description.
This week’s Action Practice focuses on asset allocation and the use of seasonality to rebalance your portfolio. A market truth is that there will always be segments that perform well and others that do not. I’ve assembled a simple model portfolio to illustrate. The principles would be precisely the same in more complex portfolios. In this model portfolio, the investor holds four Sector Funds in what is referred to as a “fixed mix.” In other words, the objective is to allocate equal portions to all four sectors and rebalance once or twice a year as dictated by returns.
We started the year with an equally balanced portfolio containing the following:
- 25% Utilities (XLU) at $25,000
- 25% Staples (XLP) at $25,000
- 25% Industrials (XLI) at $25,000
- 25% Technology (XLK) at $25,000
By the end of December, (data as of 12/14/2016) the returns had varied and caused the portfolio to become unbalanced. The total market value year-end was $114,300 which broke down as follows;
- 25.3% Utilities (XLU) up +16% and now valued at $29,000
- 23.2% Staples (XLP) up 6% and now valued at $26,500
- 26.7% Industrials (XLI) up +22% and now valued at $30,500
- 24.7% Technology (XLK) up 13% and now valued at $28,250
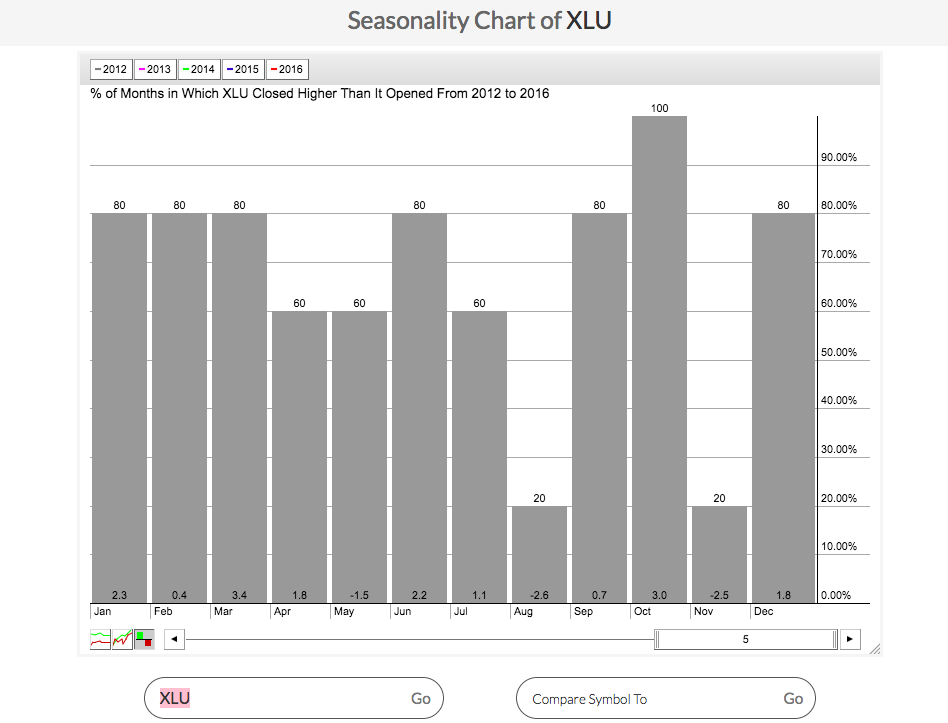
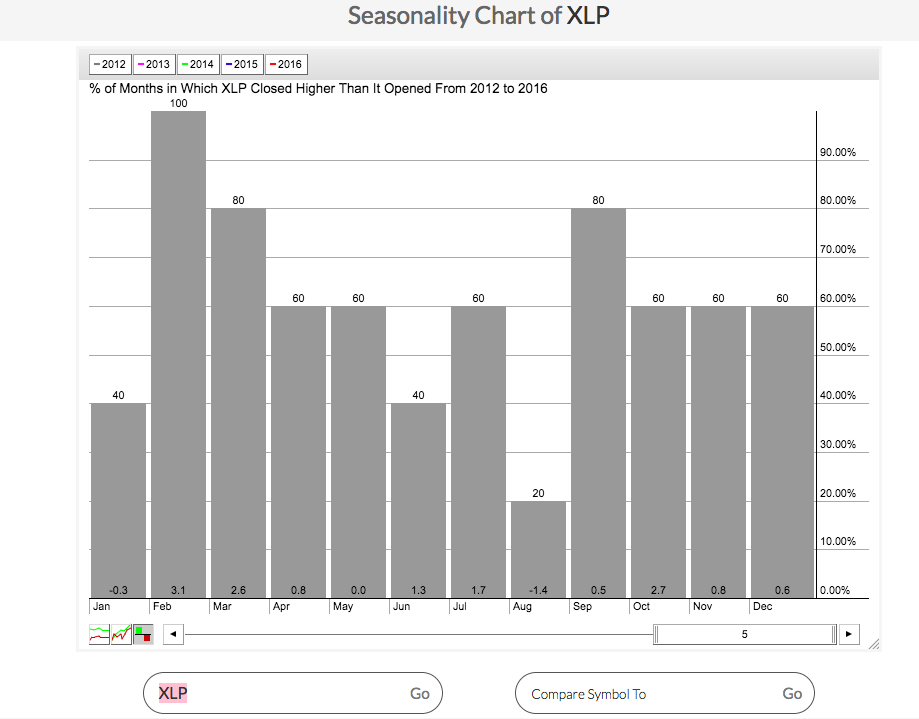
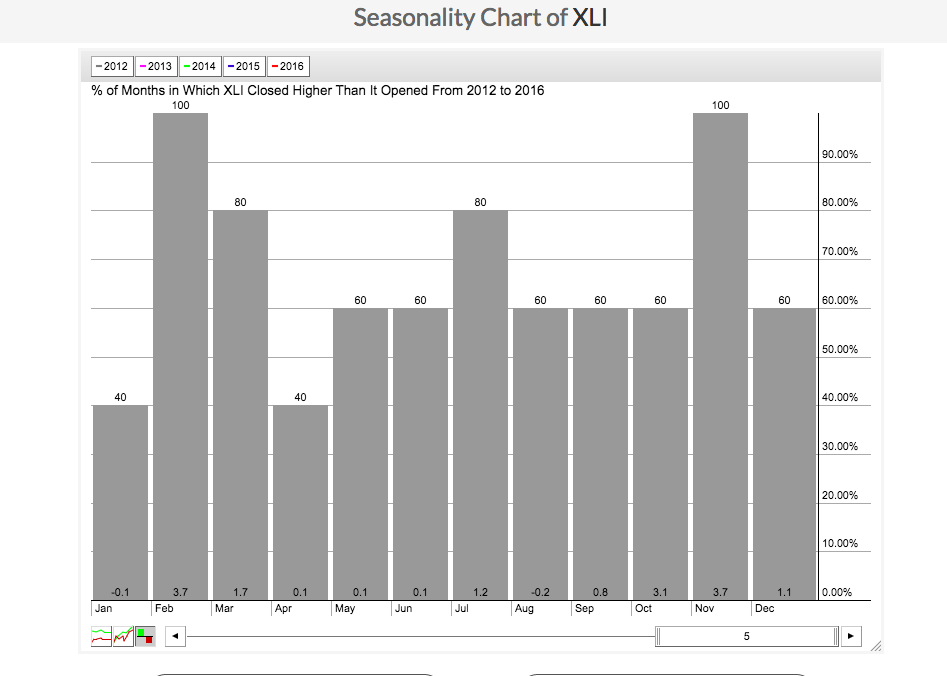
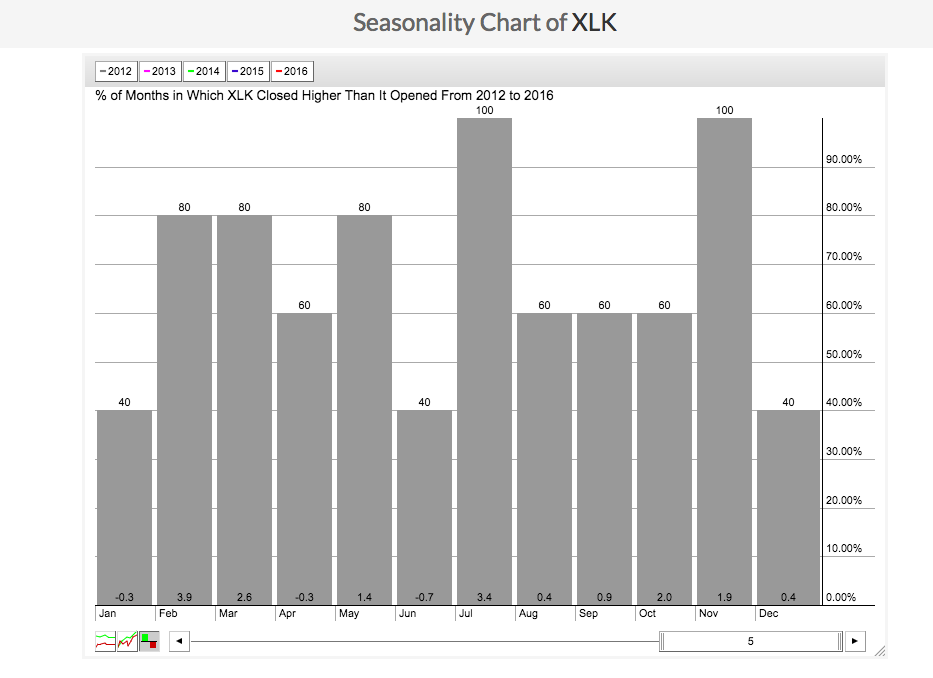
Your job is to restore the balanced “fixed mix” of 25% to each of the four sectors. On January 2, 2017, you could simply sell down the Technology (XLK) which have grown to be oversized in allocation and you could then buy more Utilities (XLU) which had lagged the growth of the other three. Or better yet, you could put the winds of probability at your back. Countless studies have shown that seasonality is a recurring anomaly in a great many equities. Exploiting this reality in timing portfolio rebalancing has been proven to statistically increase an investor’s returns. So the academics are pointing the way for us to use the power of seasonality to execute the rebalancing when it makes the most strategic sense for buying (during a weak month) or selling (during a seasonally strong month) each equity. Here then are your four seasonality charts. Formulate trading plans to rebalance this portfolio in 2017.


Trade well; trade with discipline!
- Gatis Roze
- Author, Tensile Trading: The 10 Essential Stages of Stock Market Mastery (Wiley, 2016)
- Presenter of the best-selling Tensile Trading DVD seminar
- Presenter of How to Master Your Asset Allocation Profile DVD seminar
- Developer of the StockCharts.com Tensile Trading ChartPack


