 Profits and Consistency — these should both go hand-in-hand and be goals for every successful investor. Profits are the result of a methodology that you can apply with clarity and understanding. Consistency is the result of being able to replicate your winning methodology in a recurring manner.
Action Practice #9 challenged you to draw a vertical line on six charts at a point you felt the probabilities most favored a profitable trade. Since we all require differing degrees of evidence before we are able to pull the buy trigger, the vertical buy line will no doubt vary significantly from one investor to the next. An aggressive trader may not wait for all four price relative graphs to show confirmation. Perhaps three is enough. The same with money flow. A conservative investor may require alignment of all five.
The key lessons in this exercise are that we investors play a unique sport. We can wait and wait for the perfect pitch before we swing. The market, however, is designed to entice us to swing at something less than a perfect, high-probability pitch. This is why patience is a powerful investor ally. There will always be another stock chart coming at you. The present opportunity will not be your last.
Investors who are able to keep their powder dry and only swing at the very highest probability charts will find at year’s end that their restraint and consistency produce profits. So you’ll notice the charts are annotated with my green vertical line. The highest probability chart is the one with all five parameters being met simultaneously.
A) The equity is outperforming the market (VTI). The downtrend is broken and the price relative line is beginning to trend up.
B) The sector to which this equity belongs is also outperforming the market.
C) The industry to which this equity belongs is also outperforming its sector.
D) The equity is outperforming its own brothers and sisters in its industry group.
E) Money flow is showing accumulation.
Your vertical buy line will no doubt differ somewhat from mine. Nevertheless, our objectives should be the same. Buy the equities when all five indicators produce a high probability signal.
For a much more detailed explanation on our Tensile Trading methodology, I’d refer you to either our book or two-disc DVD
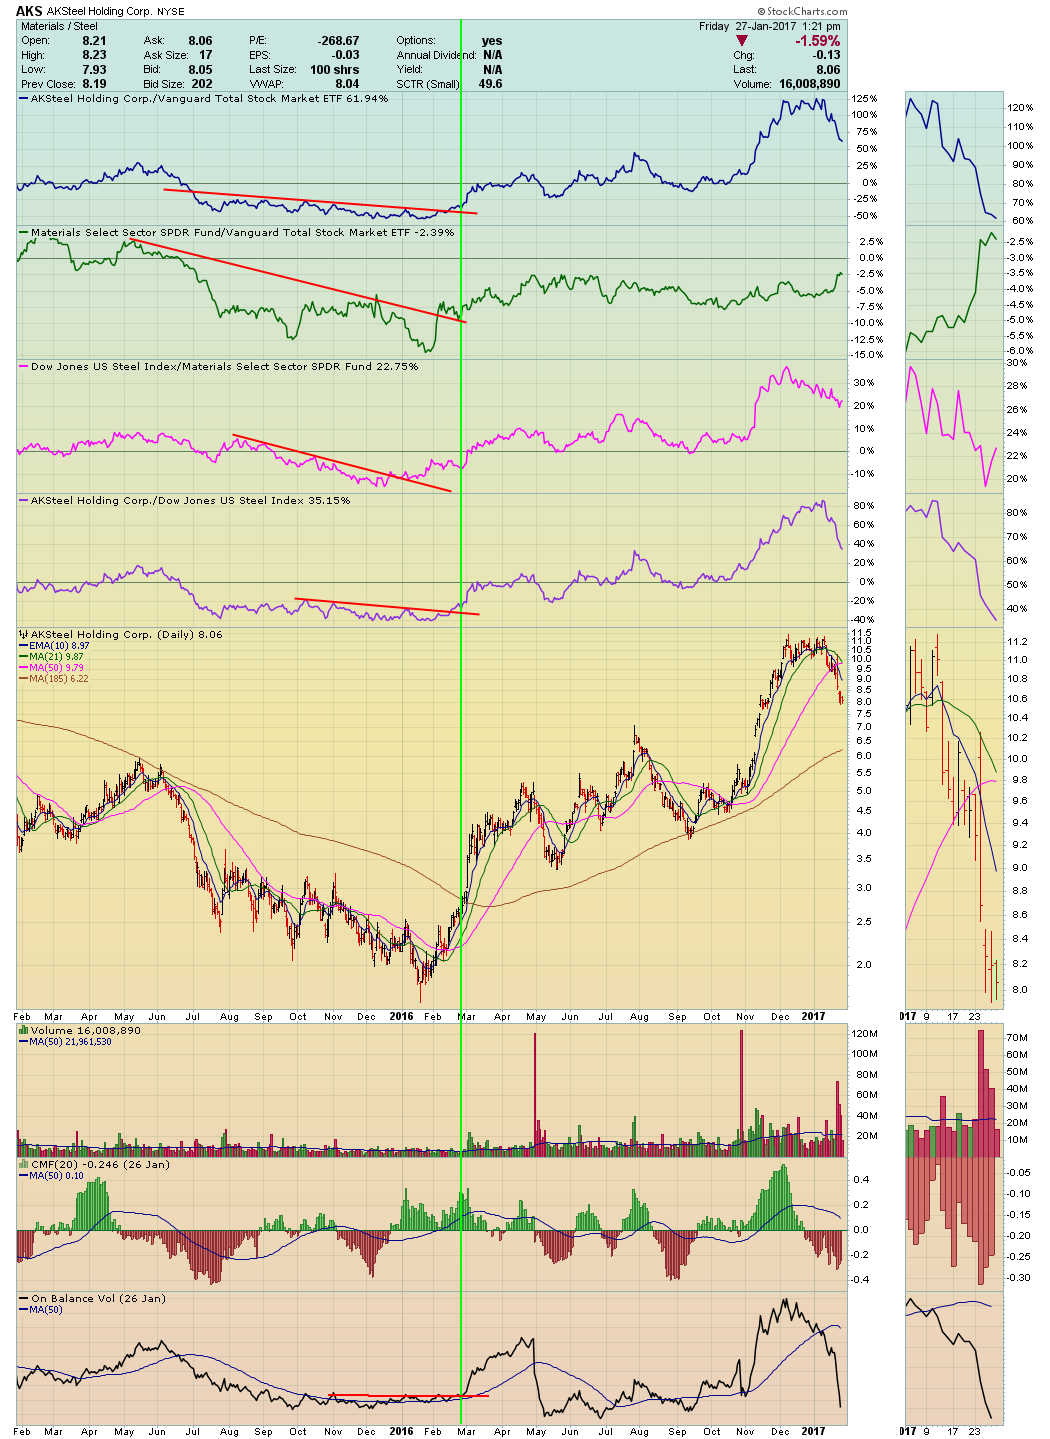
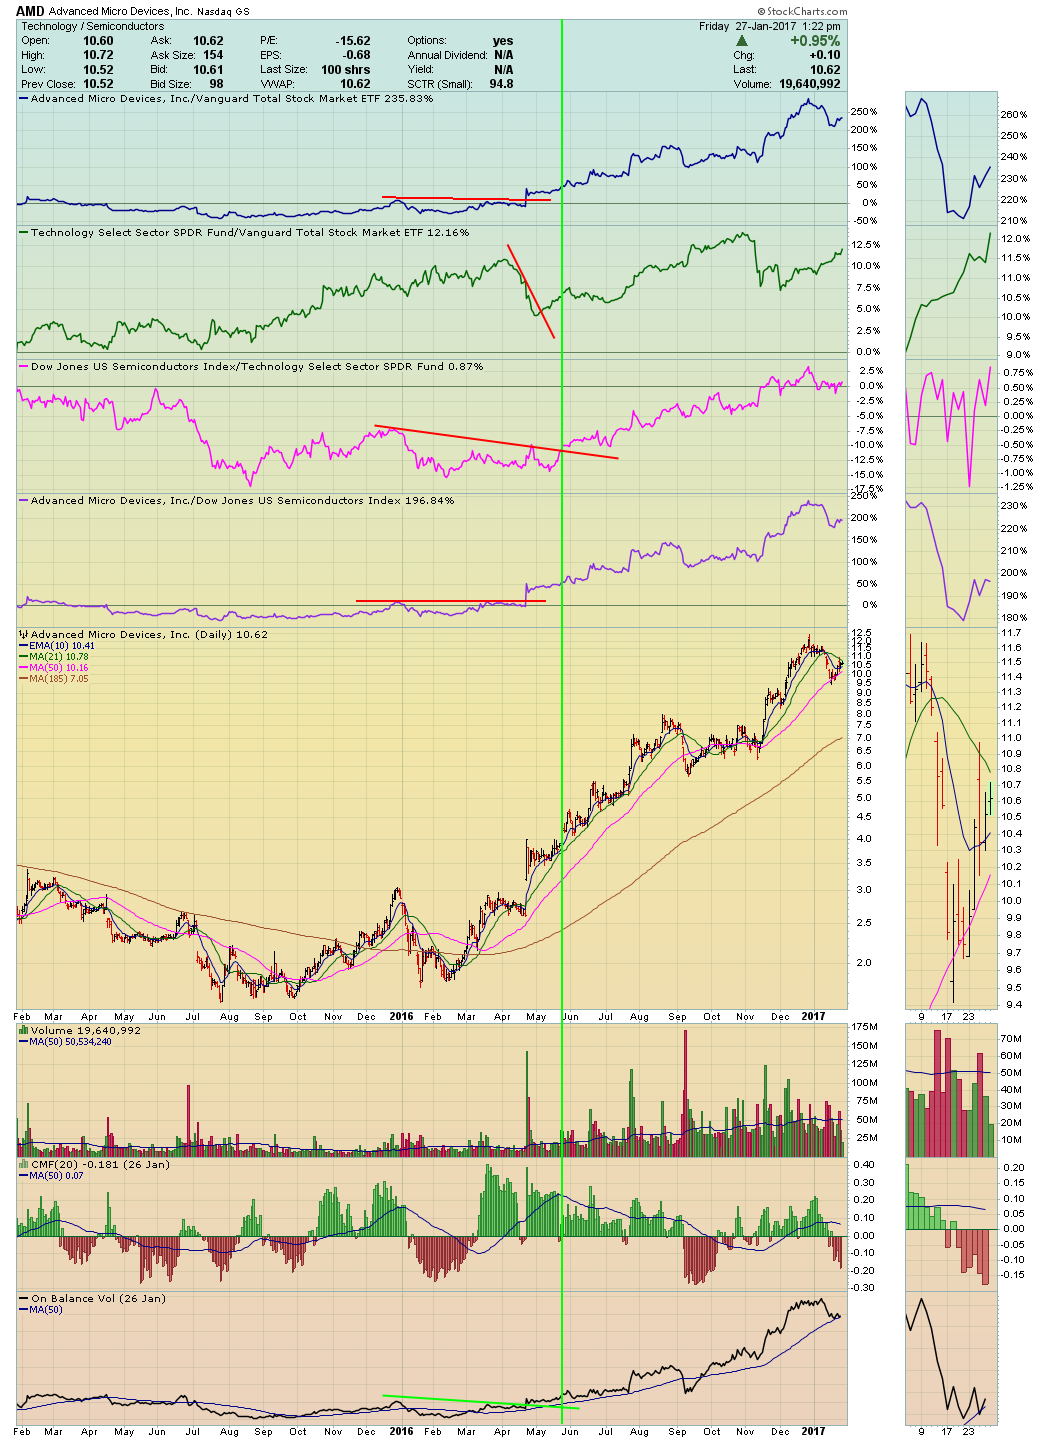
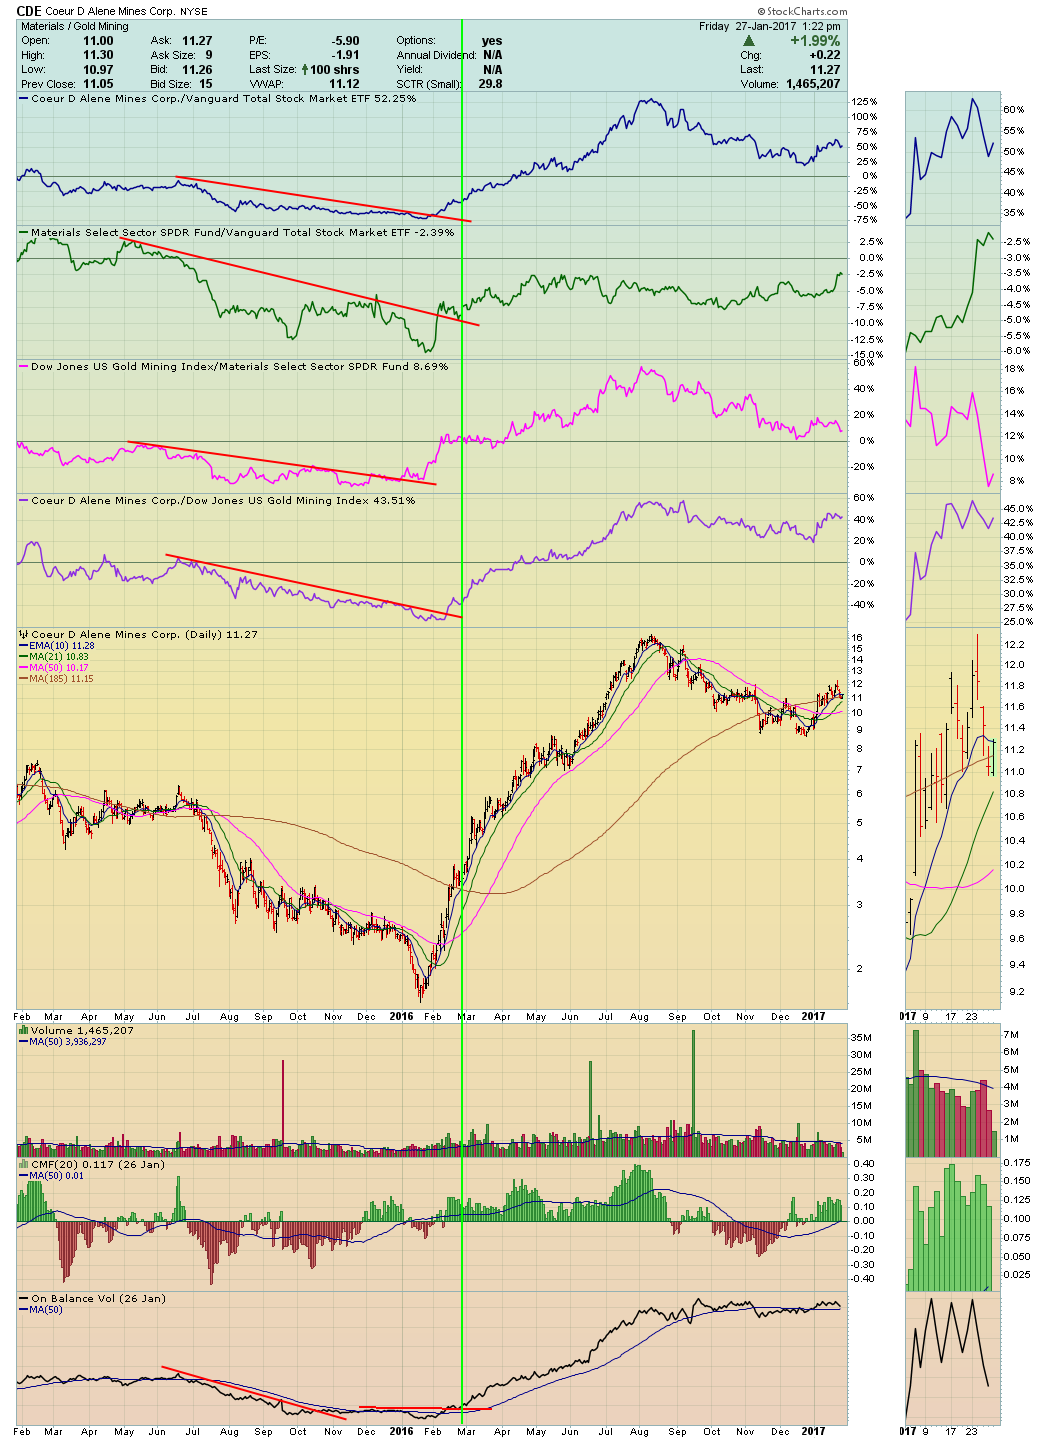
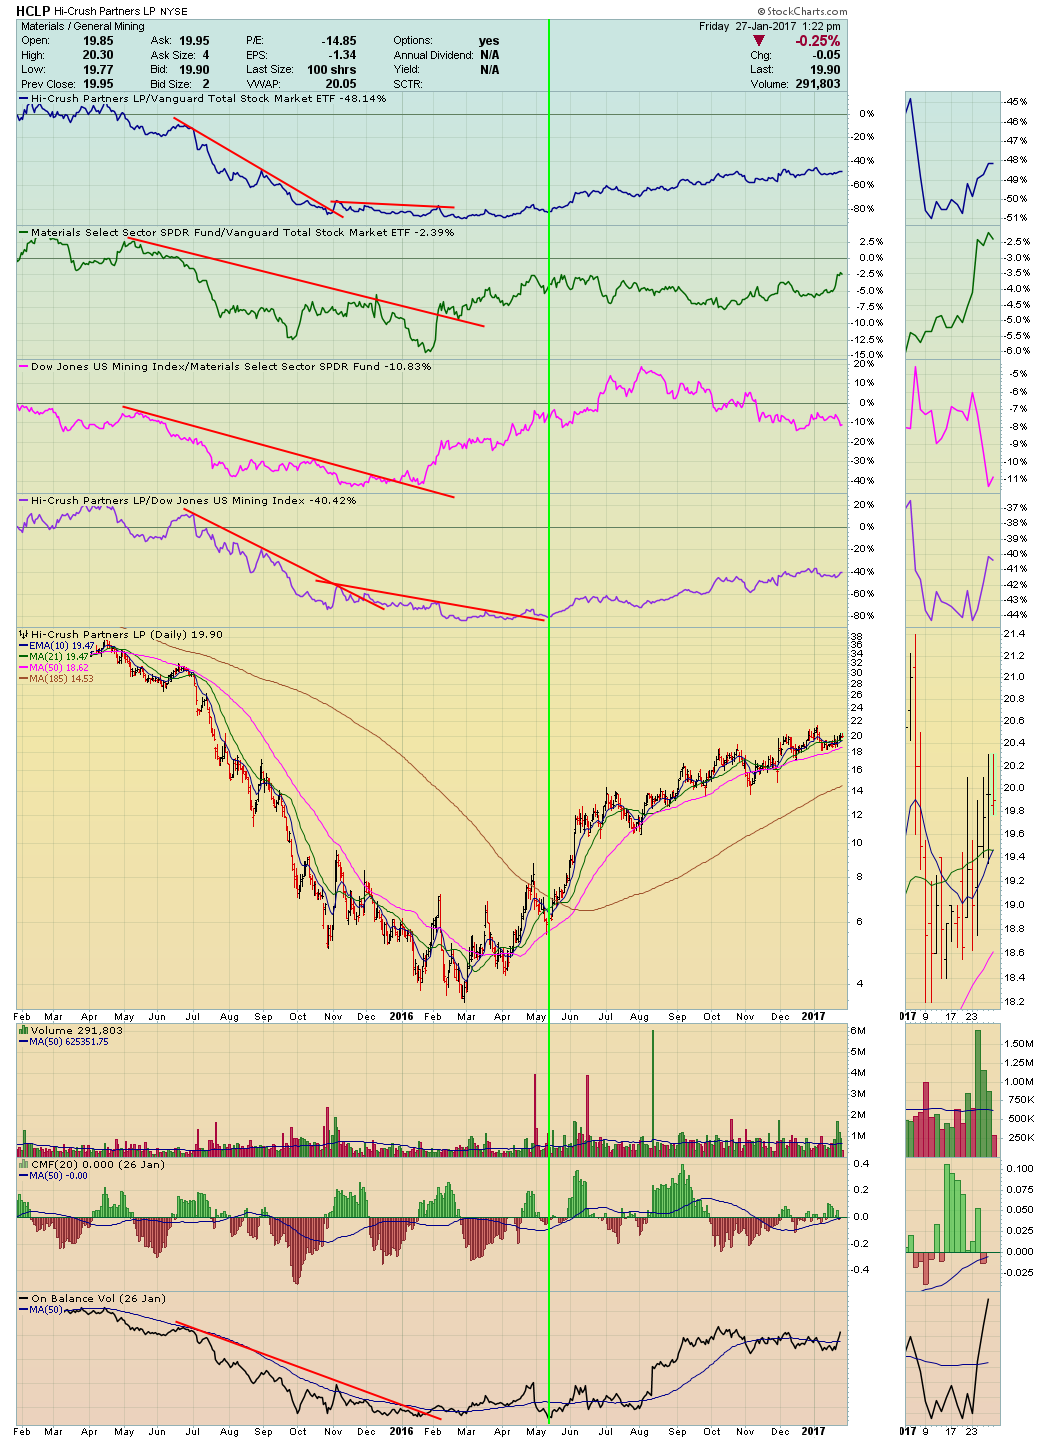
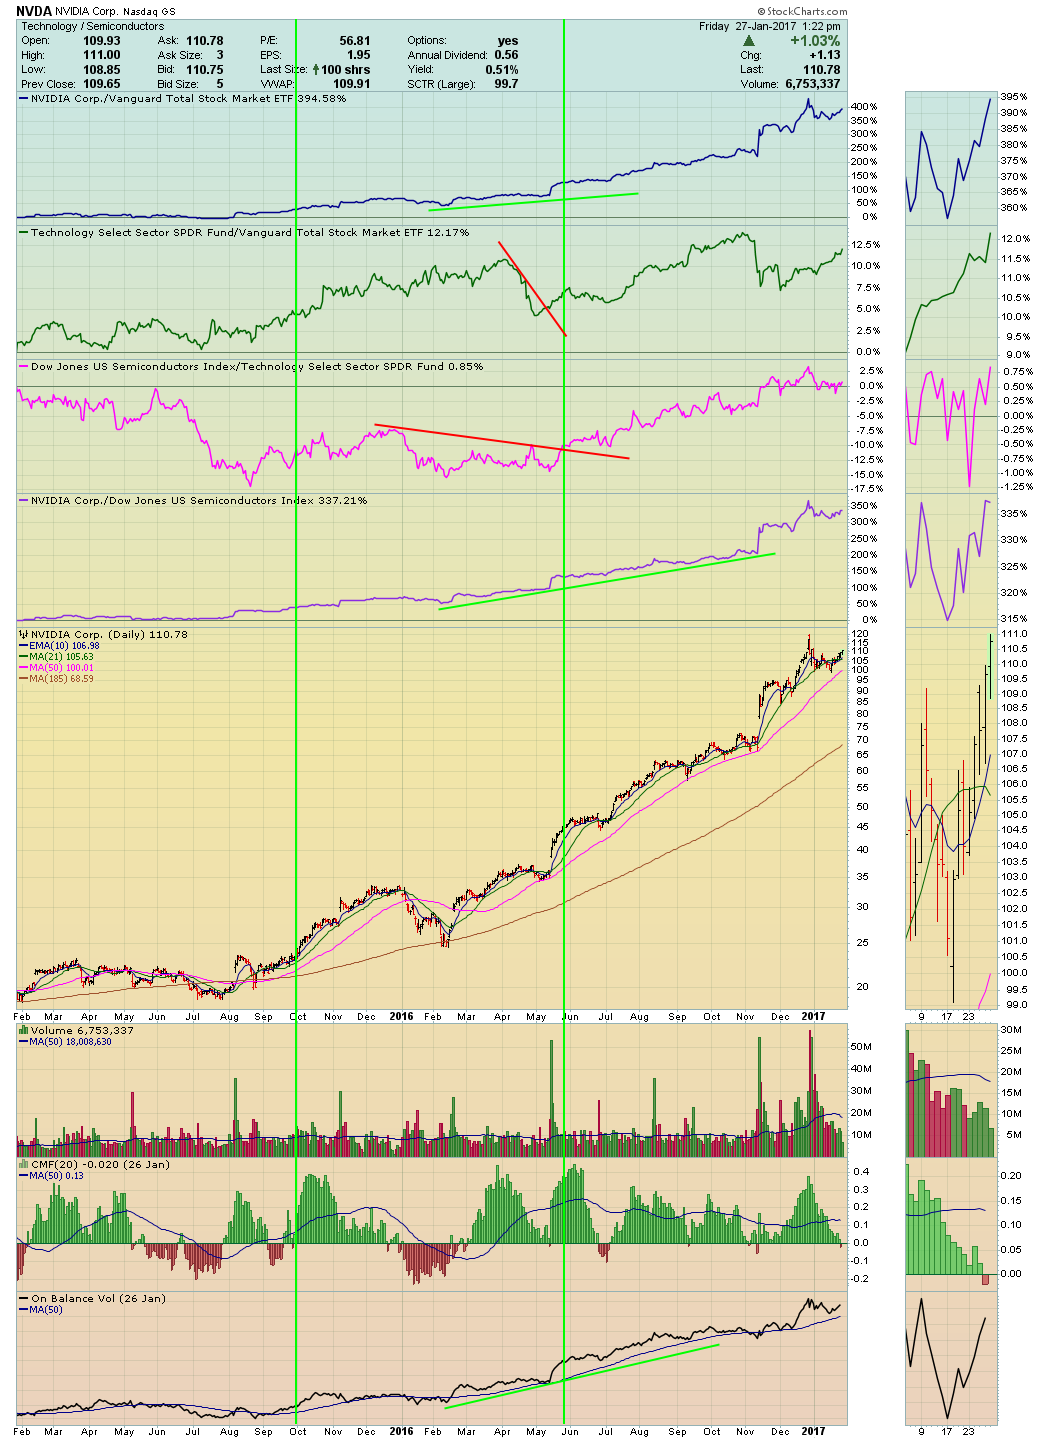
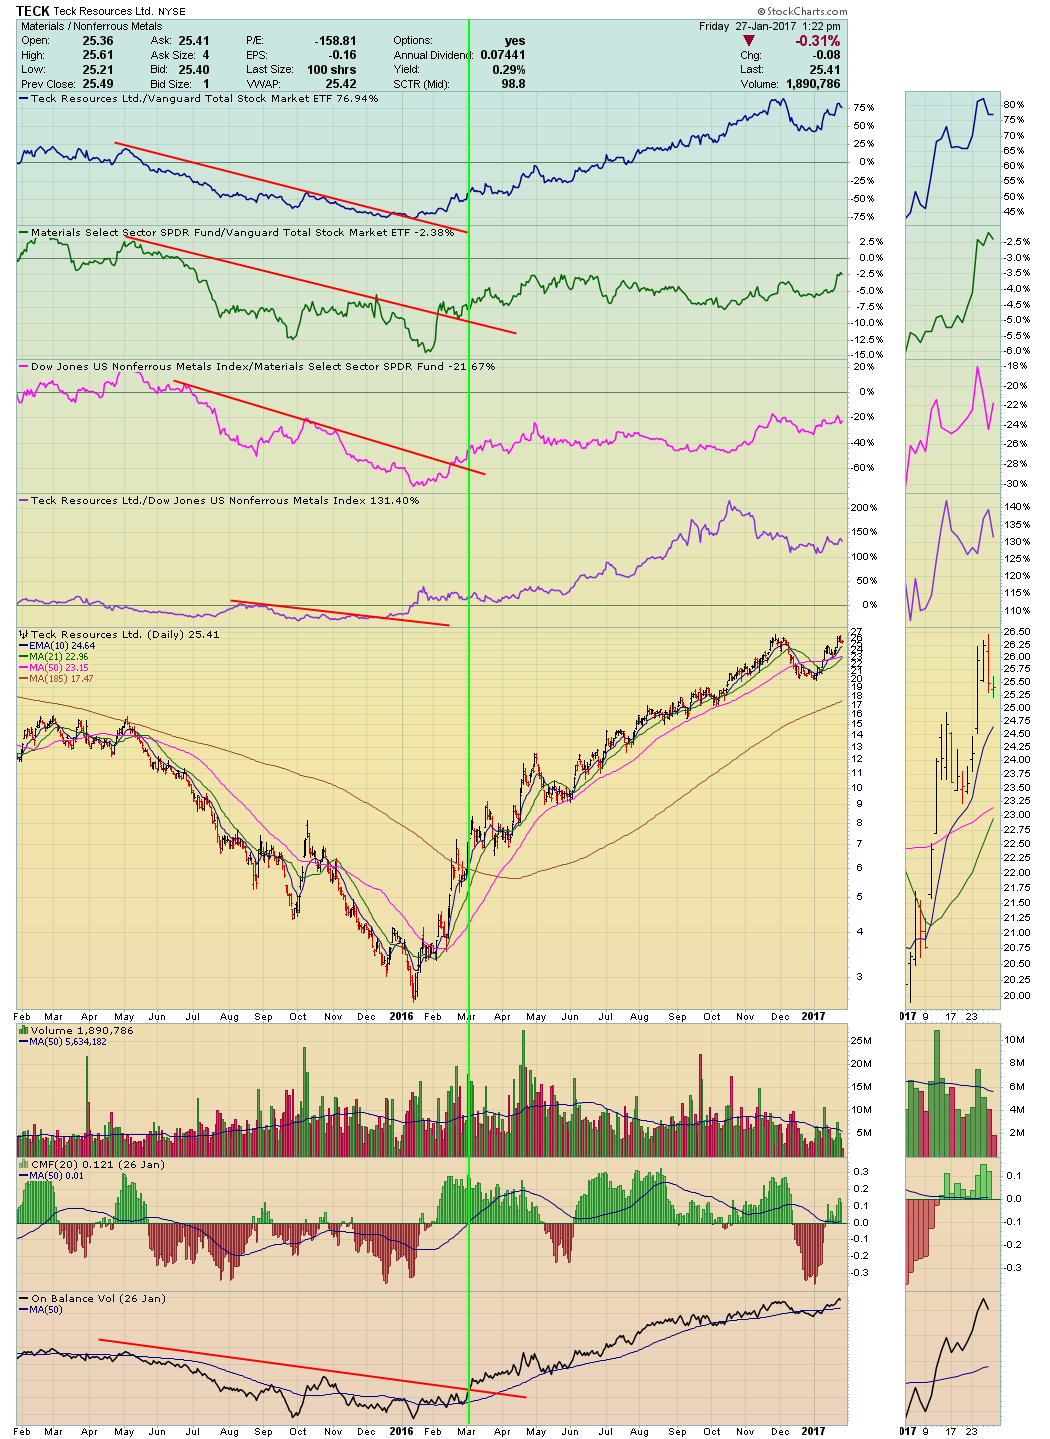
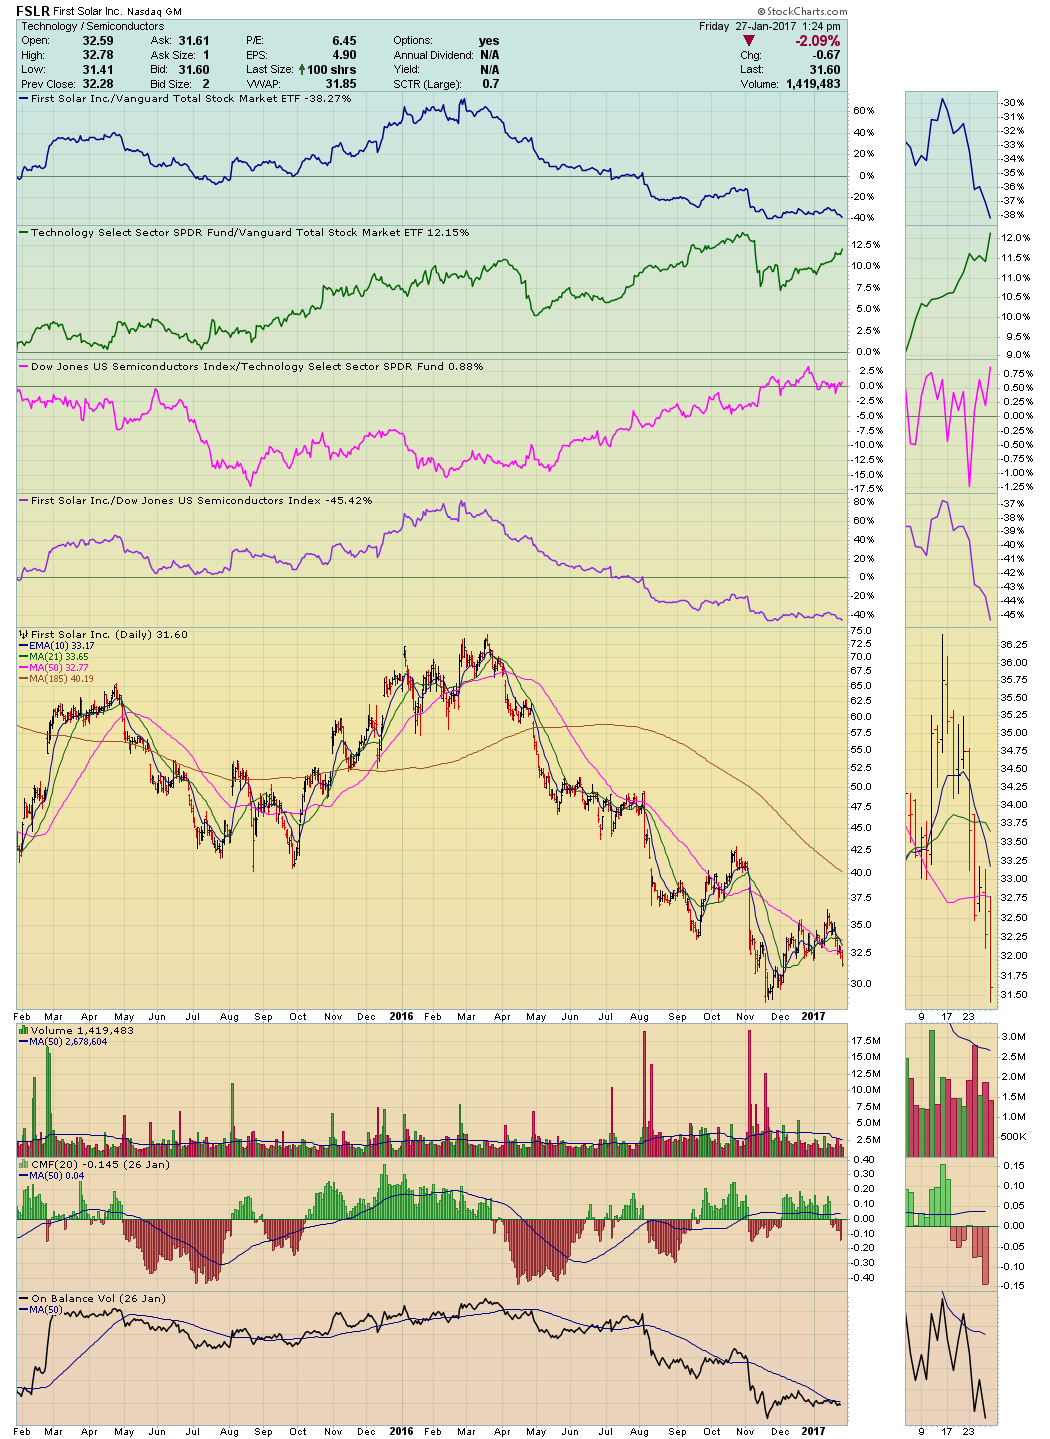
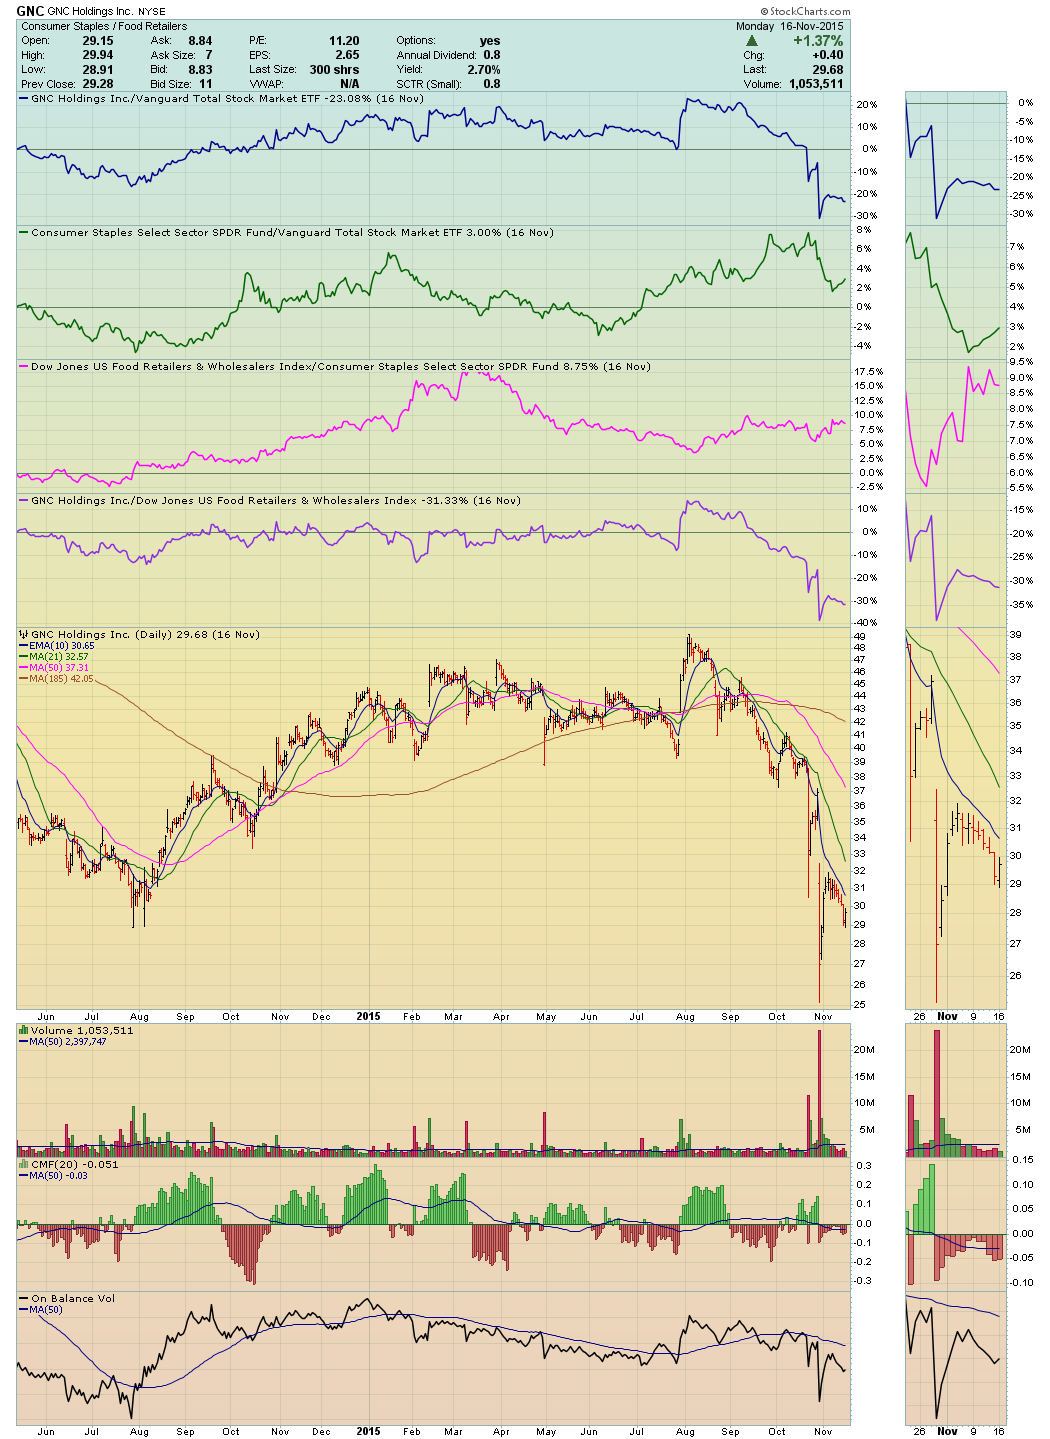
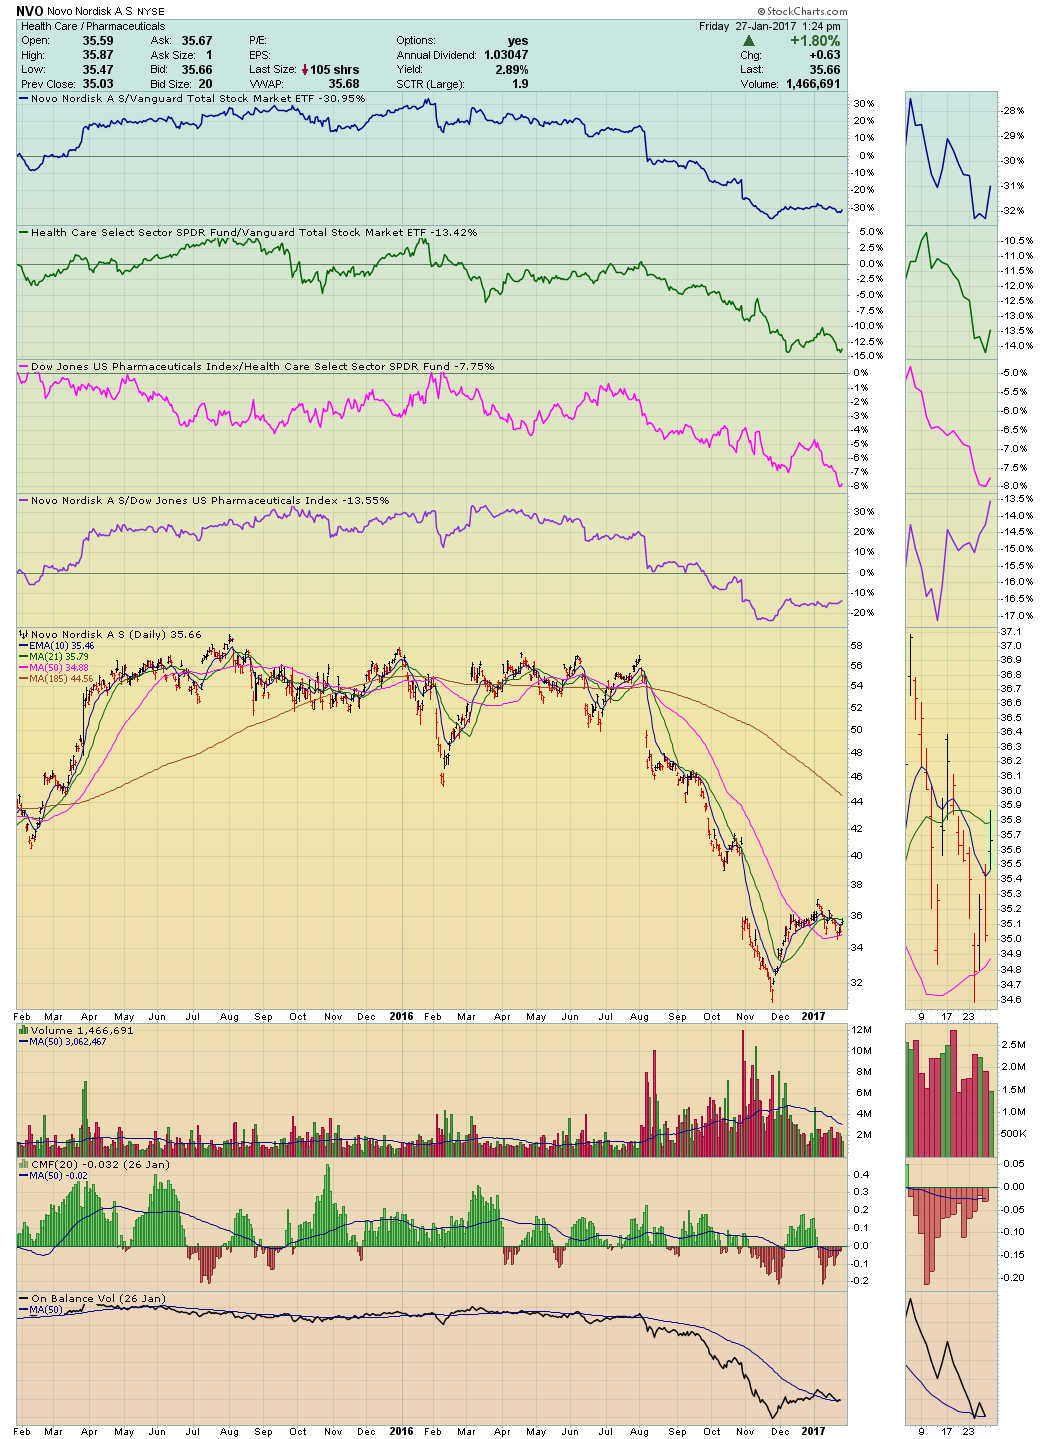
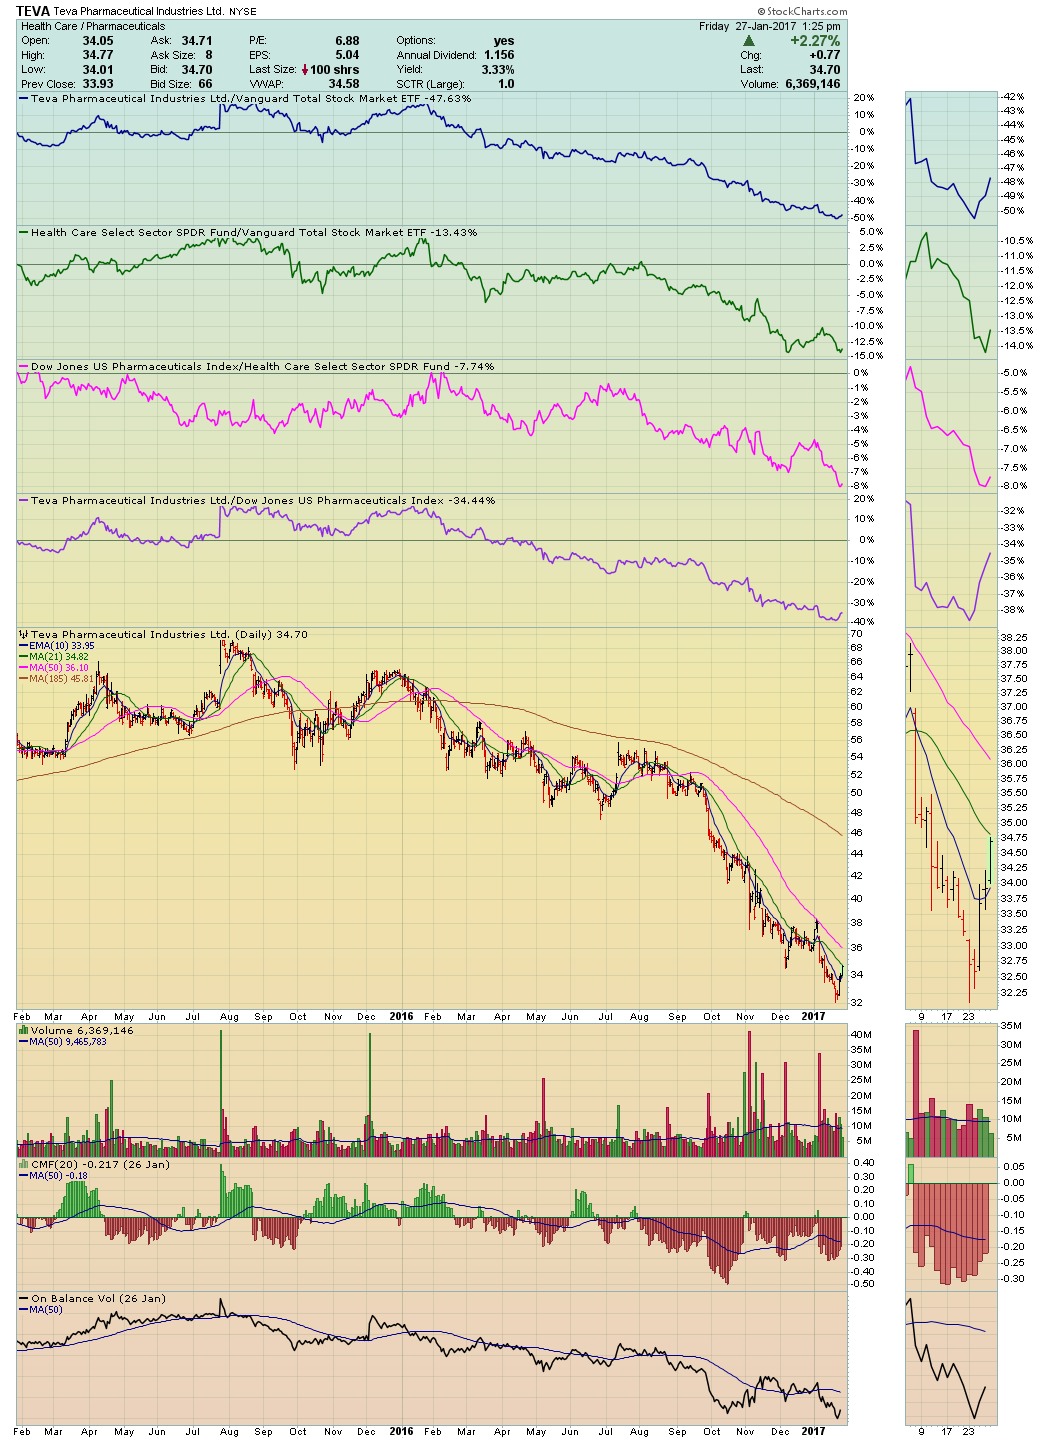
For this week’s Action Practice, it seems reasonable to replicate the same price relative exercise on the sell side. Let’s even revisit CDE from the buy side exercise and show how the Tensile Trading methodology works going into — as well as coming out of — a position. Now we flip the five parameters over as we seek to exit our positions. Remember that the market is happy to continue to offer you more sell clues, but the cost will always be a lower price.
The classic Faustian bargain you make with each equity is this: Exactly how many clues would you personally like to buy before you are able to pull the sell trigger? So the challenge before you this week is: Where do you draw your personal vertical sell line on these six equities?
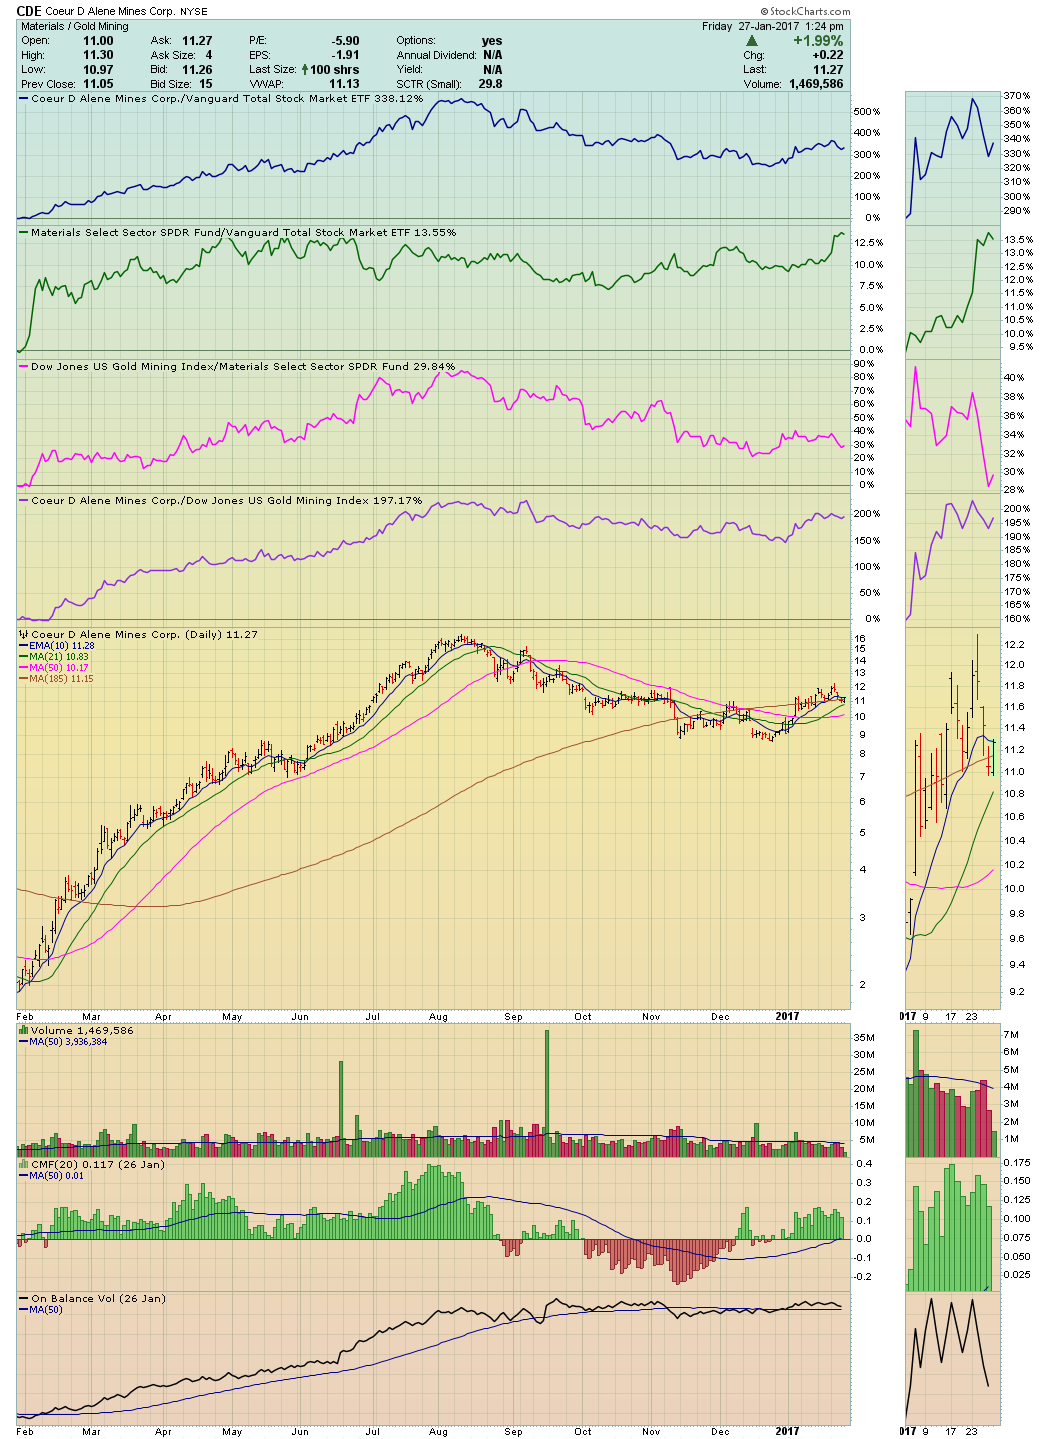
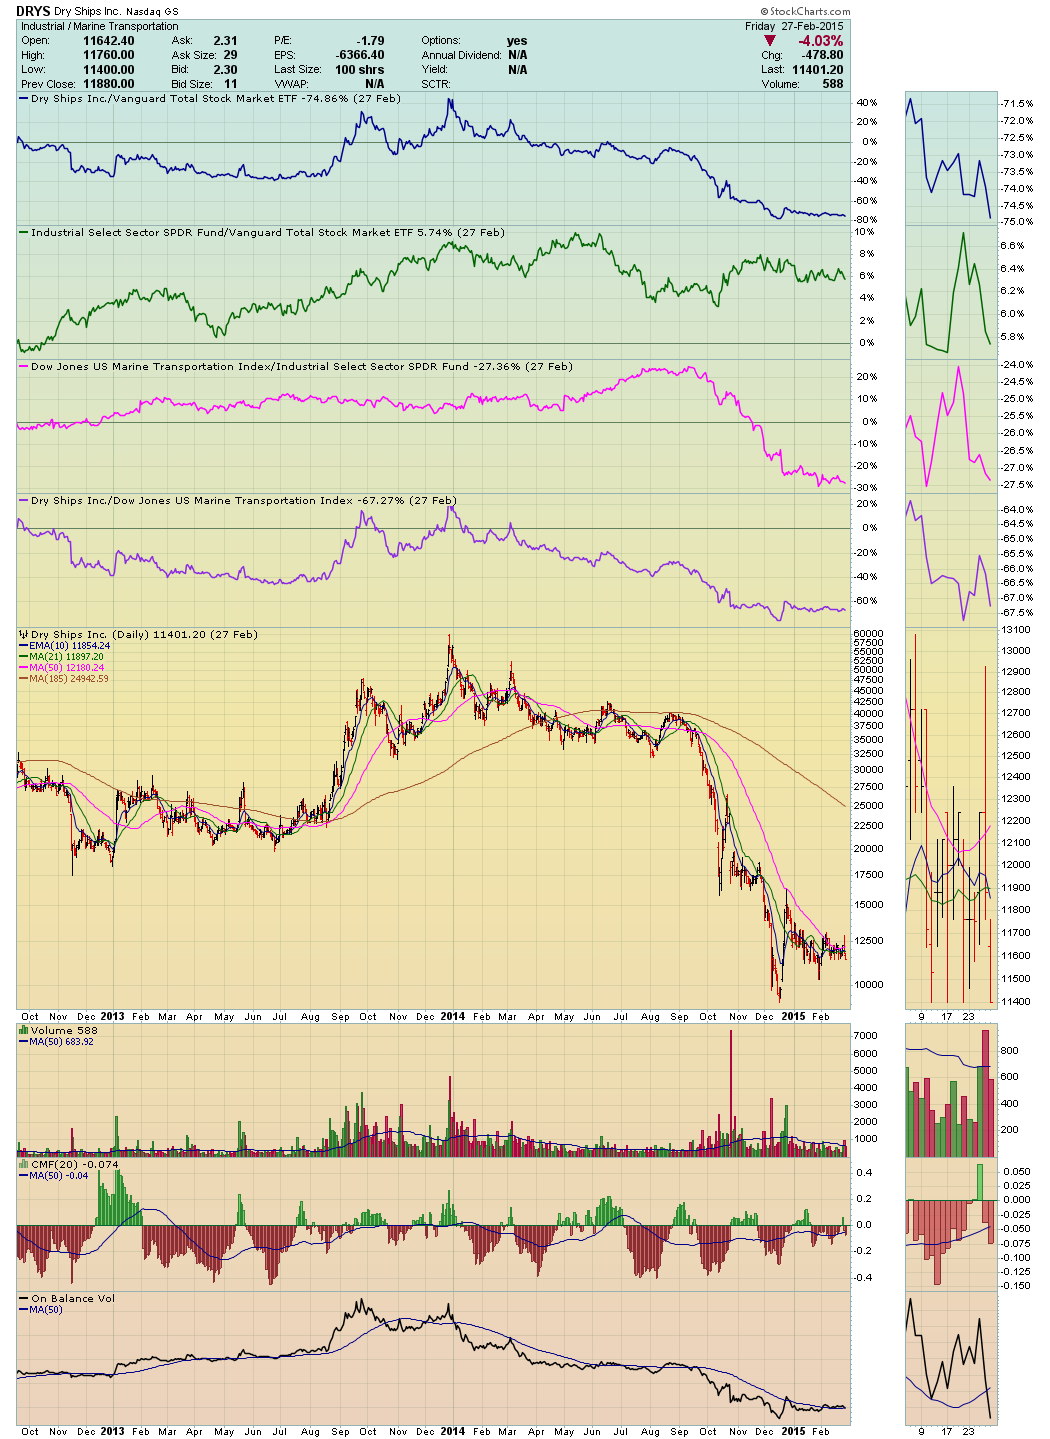
Trade well; trade with discipline!
- Gatis Roze, MBA, CMT
- Author, Tensile Trading: The 10 Essential Stages of Stock Market Mastery (Wiley, 2016)
- Presenter of the best-selling Tensile Trading DVD seminar
- Presenter of How to Master Your Asset Allocation Profile DVD seminar
- Developer of the StockCharts.com Tensile Trading ChartPack


