 For those readers who embrace my CORE and EXPLORE approach (this is actually my version of John Bogle’s approach) with respect to Asset Allocation, you can see why I suggest considering country funds for a small percentage of your EXPLORE portfolio. Country funds fulfill the cardinal rule of diversification as their correlations to the USA markets are much lower. Over the past 30 years, the world’s top performing market has come from this group 100% of the time (outside the USA).
I personally believe that actively trading a few focused equities in one’s country fund global asset basket can provide the equity growth you seek and can improve your skill in investing in less volatile asset classes within your portfolio. Make no mistake about what I’m saying. This asset class is for active traders who have the discipline to keep a close eye on these volatile equities, with the additional caveat that it should represent only a small percentage of your total EXPLORE portfolio.
Now let’s revisit the country funds from our Action Practice #12 blog (February 24, 2017).
From January 23 - February 23, 2017, all of these country funds were outperforming the Vanguard Total Market (VTI). Having said that, when you installed the six candidates on a PerfChart, lo and behold, the bottom two (EWZ-Brazil and ILF-Latin America) were still the bottom two performers a month later. My point here is to buy relative strength rather than bottom fishing for turnarounds.
The Action Practice exercise on February 24th was to rank the six candidates. Using the same methodology we deployed in the prior blog, I classified them into Group A (most attractive), Group B and Group C (least attractive) as follows (Performance 2/23/17 - 3/20/17)
- Group A: Poland (EPOL) +3.41% and China (FXI) +1.69%
- Group B: Turkey (TUR) +.36%
- Group C: Brazil (EWZ), Latin America (ILF) and Brazil Small Caps (BRF)
Here are the results.
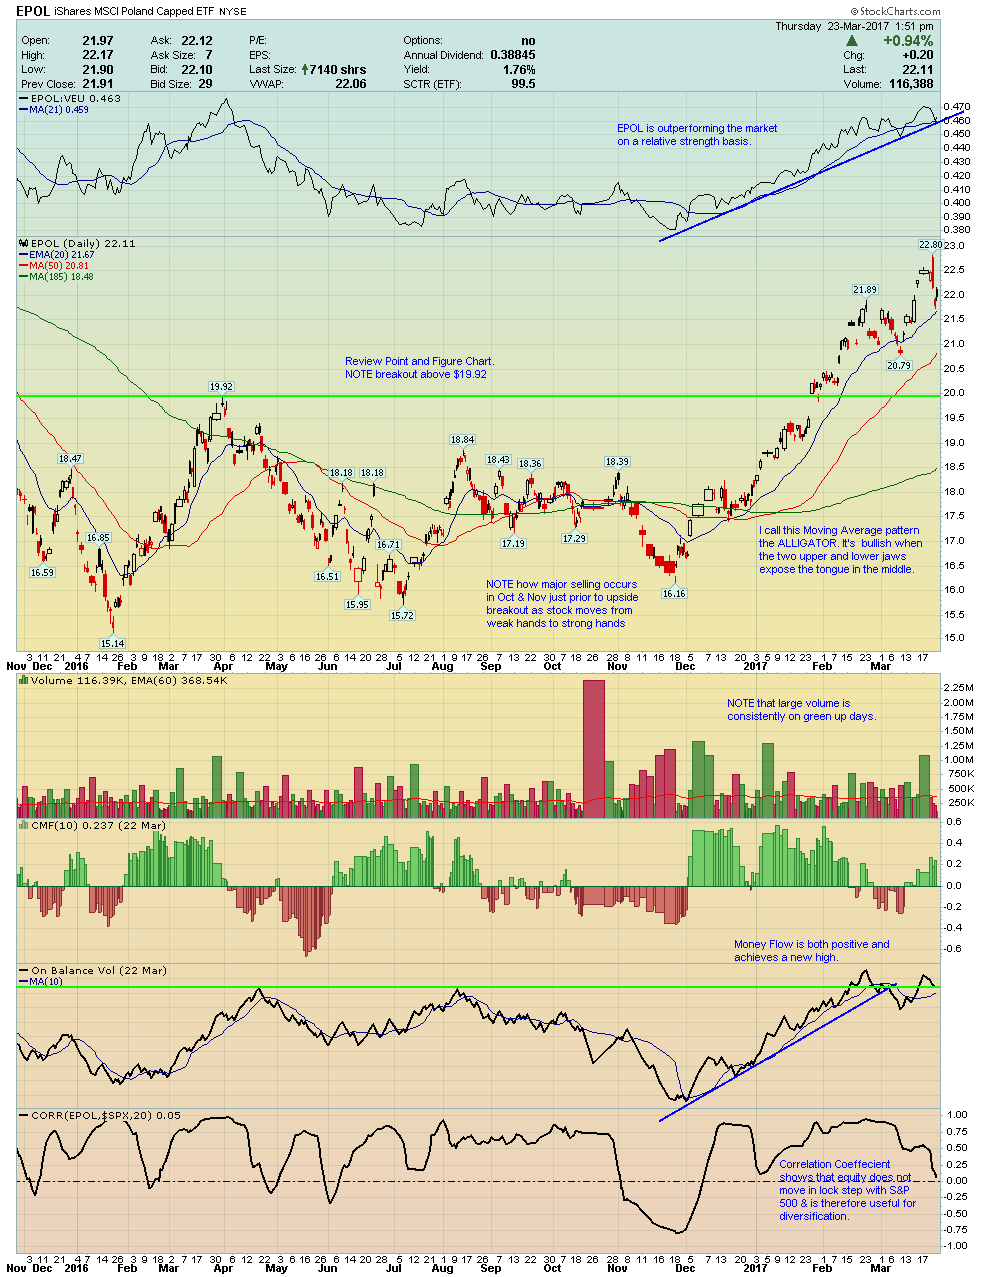
- A review of the six candidates’ Point & Figure Charts clearly illustrated the potential upside. Both EPOL and FXI had the two most attractive P&F charts.
- Brazil Small Caps (BRF) was an interesting case. It’s P&F chart was underwhelming. The seasonality indicator for March was trending down. Both globally and domestically (VB), Small Caps were beginning to underperform their Big Cap brethren. In addition, after a very strong outperformance for small caps from November 2016 to January 2017, BRF was guilty by association because its big brethren, EWZ, was beginning to fade on a relative performance basis and money flow was weakening. Its yield was also 3.46% (the highest of all the candidates) versus Brazil (EWZ) which was 1.63%. This situation therefore added to my uneasiness about the sustainability of its price move.
- The reason that I picked both Poland (EPOL) and China (FXI) for Group A gets back in part to their P&F charts. Both are breaking out above their trading ranges — EPOL above $19.92 and FXI above $38.40. Poland’s money flow was clearly stronger, and indeed that continued to be the case as it neared double the percentage appreciation achieved by FXI (+ 3.41% versus +1.69%).
This Week’s Action Practice:
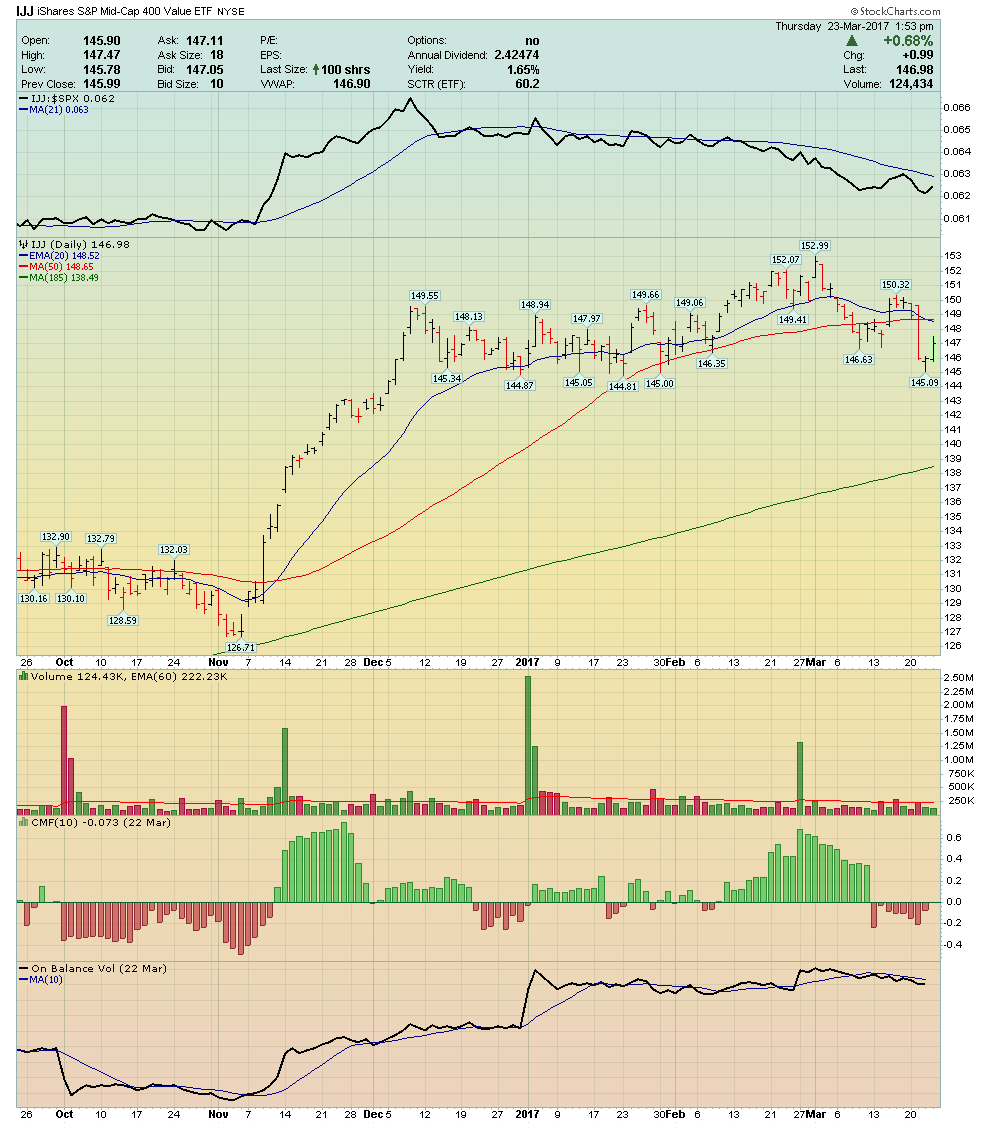
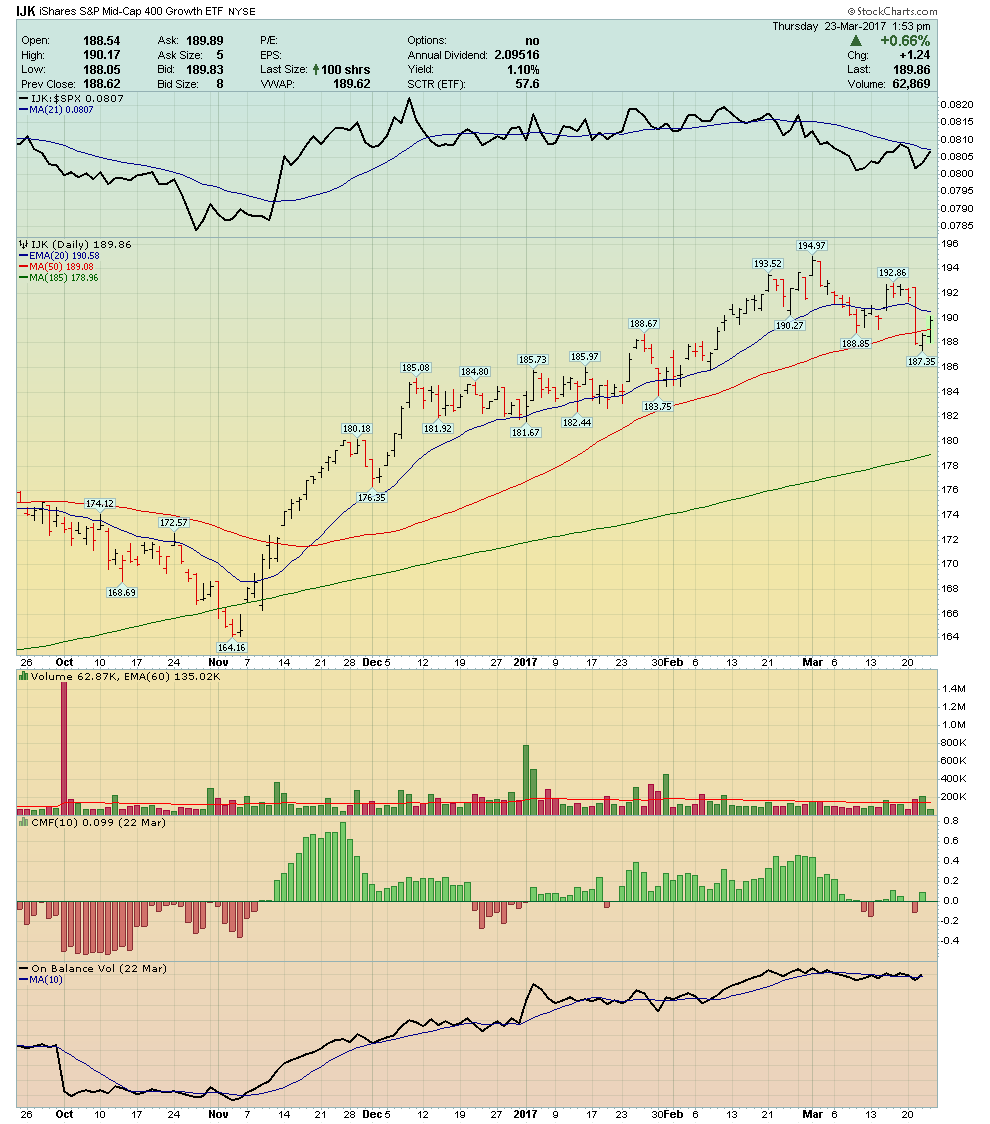
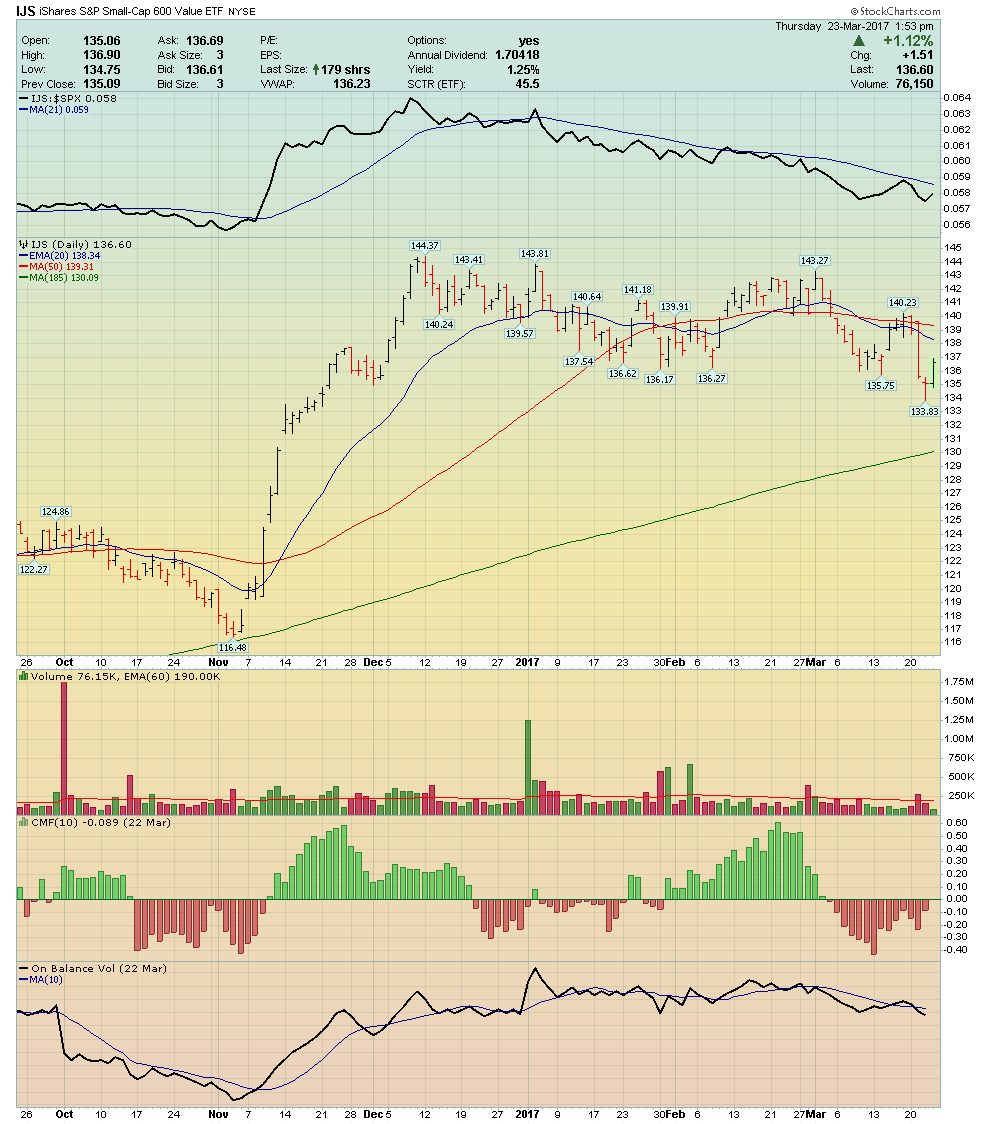
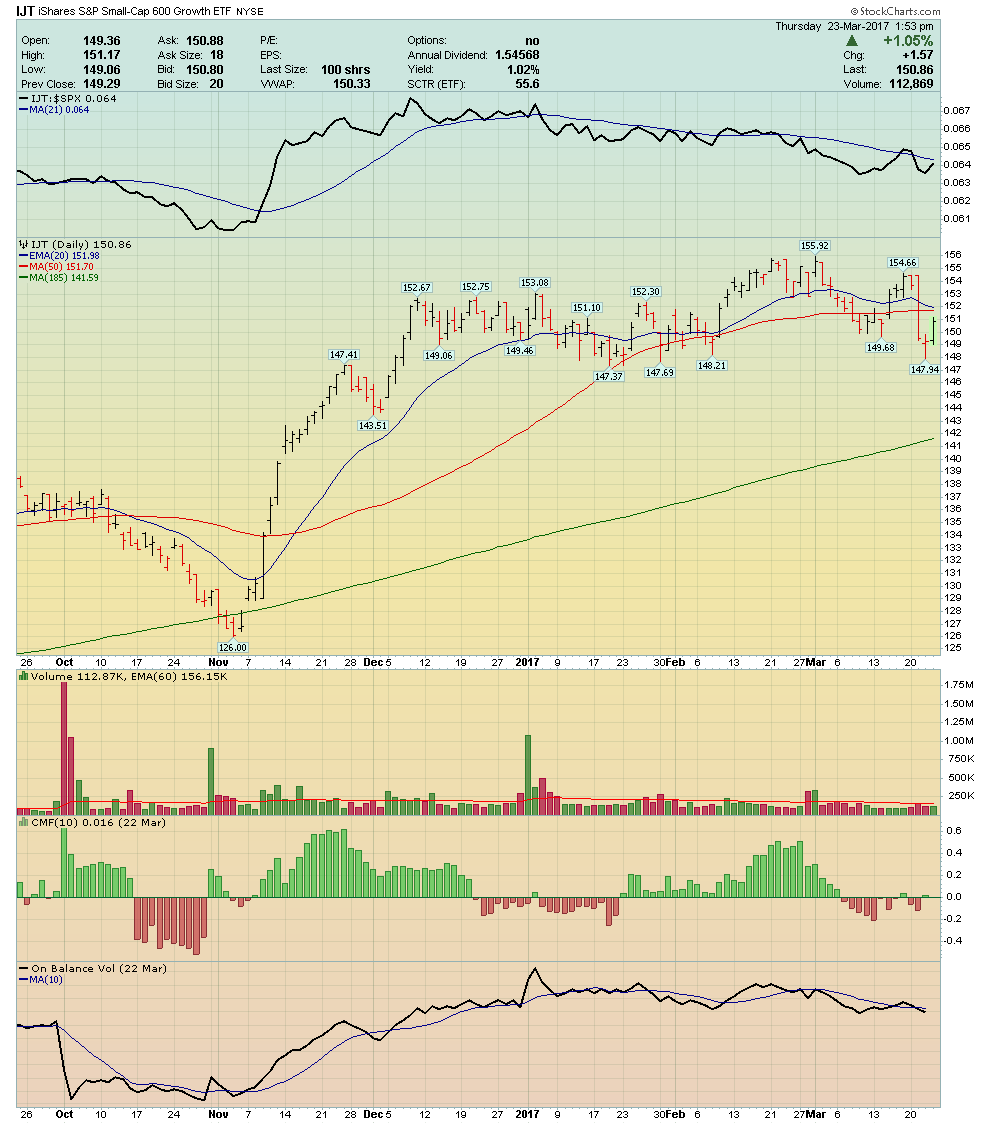
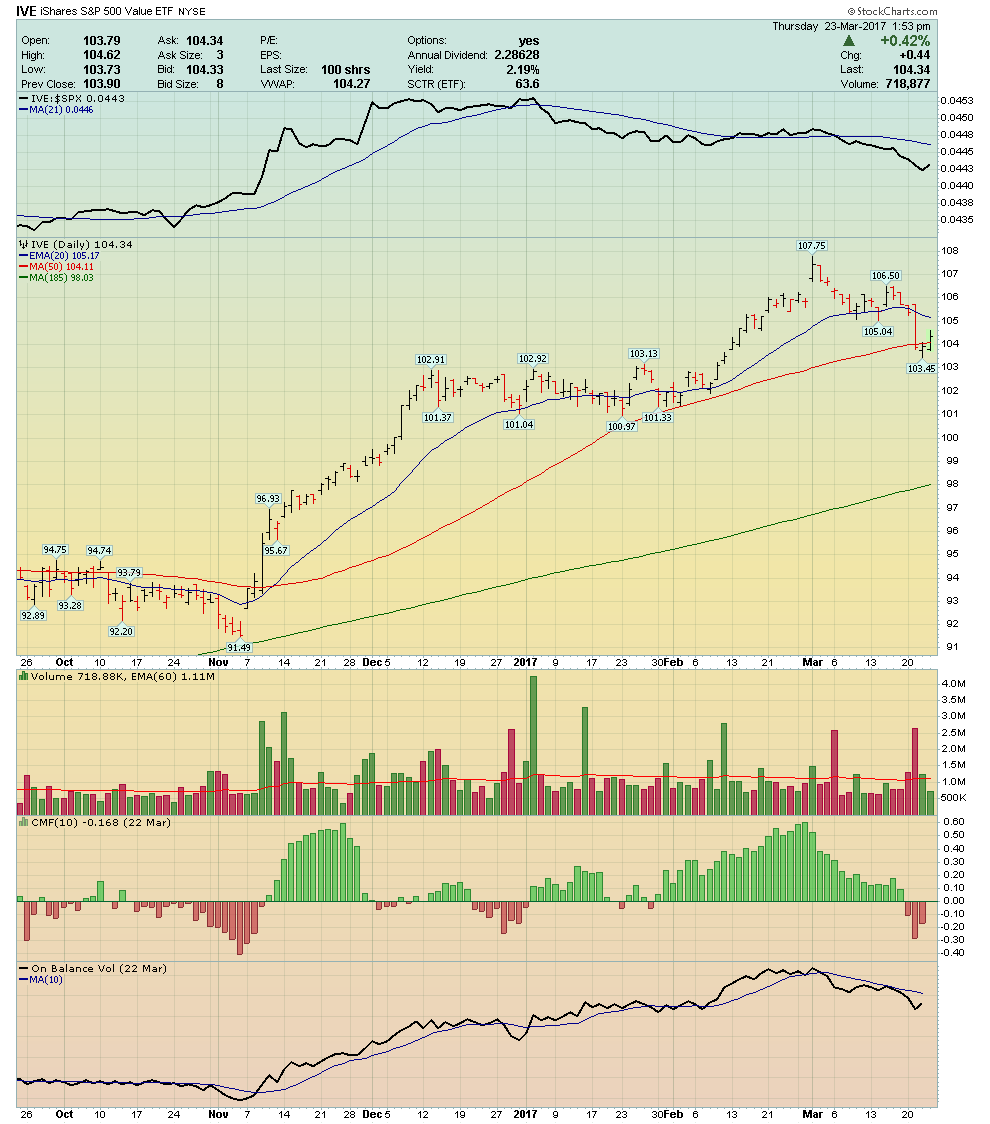
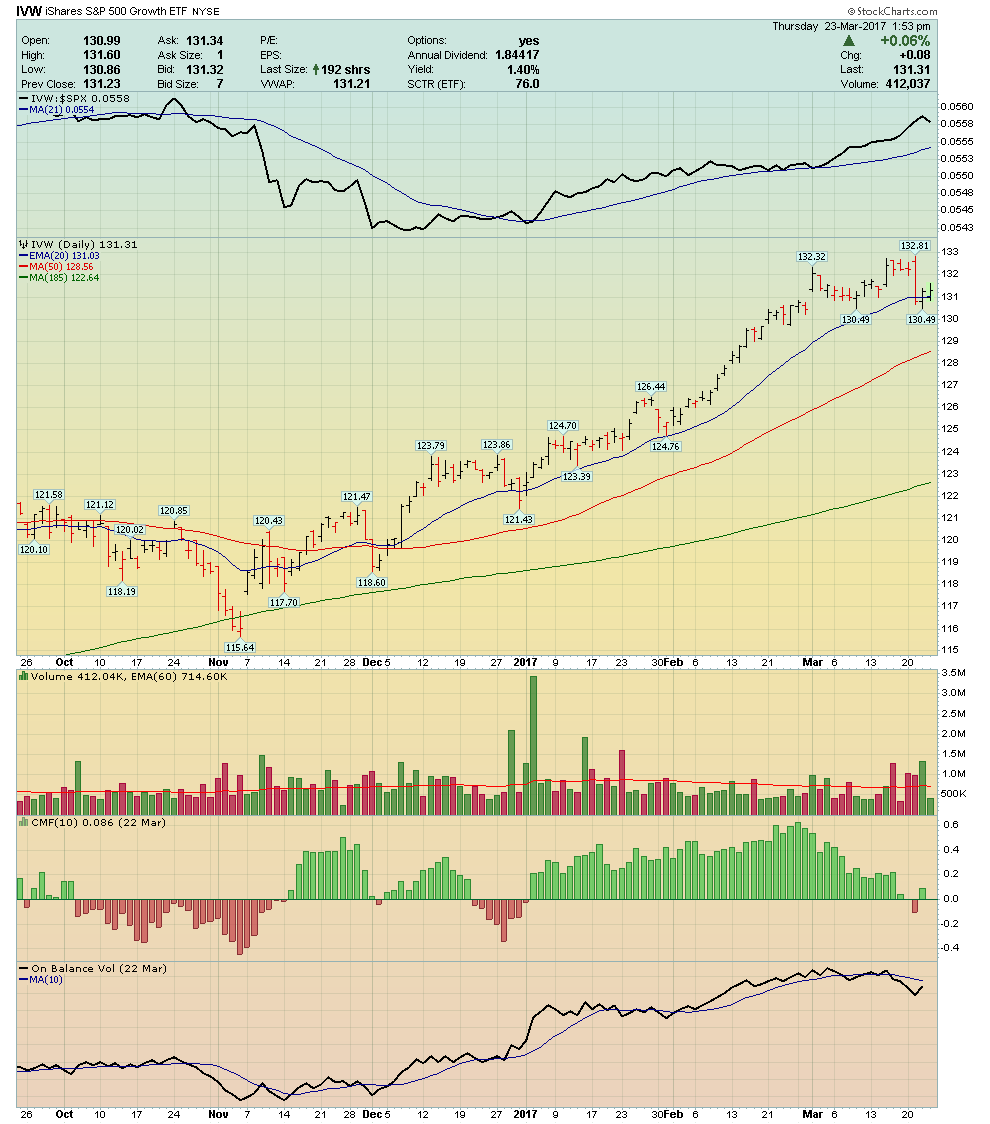
Irrespective of whether you are a shorter-term trader or a longer-term investor or something in between, the second question you must ask yourself (after answering the first question — which is “what’s the trend of the market”) is to ascertain if the market is favoring growth versus value equities, and further, within those parameters whether it is favoring large, mid or small cap stocks.
These are essential insights necessary to get the “winds of probability” at your back as you invest. Therefore, your objective in this week’s exercise is to identify the present inclinations of the market for those parameters. The following six charts are all iShares ETFs. Feel free to incorporate other ticker symbols if you feel they will better help you uncover the market’s present inclinations.
Trade well; trade with discipline!
- Gatis Roze, MBA, CMT
- Author, Tensile Trading: The 10 Essential Stages of Stock Market Mastery (Wiley, 2016)
- Presenter of the best-selling Tensile Trading DVD seminar
- Presenter of How to Master Your Asset Allocation Profile DVD seminar
- Developer of the StockCharts.com Tensile Trading ChartPack


