 At a May 20th presentation to the Seattle chapter of the AAII, Paul Merriman confirmed to me his standing as a respected elder of investment management. Since selling his multi-billion dollar advisory firm in 2012, he has been running a financial education foundation. His motto “knowledge is power” is an accurate portrayal of his mission, and parallels my own efforts to educate and empower individual investors these past 20 years.
What makes Merriman’s motto so unique is that it’s backed up by a depth of experience few have attained and delivered honestly in a philanthropic voice that says “this is what’s best for individual investors.” My intention here is not to paraphrase his AAII presentation but to highlight two indispensable points he made that day.
The first is that individual investors would be best served if they significantly increased the time, energy and focus they devote to asset allocation decisions pertaining to their portfolios. This is something that Grayson and I have detailed in depth in our book and lectured about in our seminars. We even created a comprehensive two-disc DVD seminar to highlight all the imperative topics.
https://store.stockcharts.com/collections/dvds/products/how-to-master-your-asset-allocation-profile
The second part of Merriman’s presentation challenged all investors to understand that they must know the answers to essential fundamental stock market questions. When the audience of approximately 150 investors was polled and asked if they had ever heard of stockcharts.com, only about 40% of them raised their hands. More than half of them thereby admitting that they were unfamiliar with this website.
Herein lies the stunning observation. How do these investors go about answering Paul Merriman’s essential questions and monitoring the answers on an ongoing basis? Let’s rephrase the issue. If the majority of investors in that AAII audience had never even heard of stockcharts.com (let alone used it), we can only assume that they’re exclusively fundamentalist investors. How then do they answer these quintessential questions?
I would like to show these investors how I can answer ten questions quickly, easily and cleanly in just about two minutes. Welcome to the powerful and profitable world of visual investing!
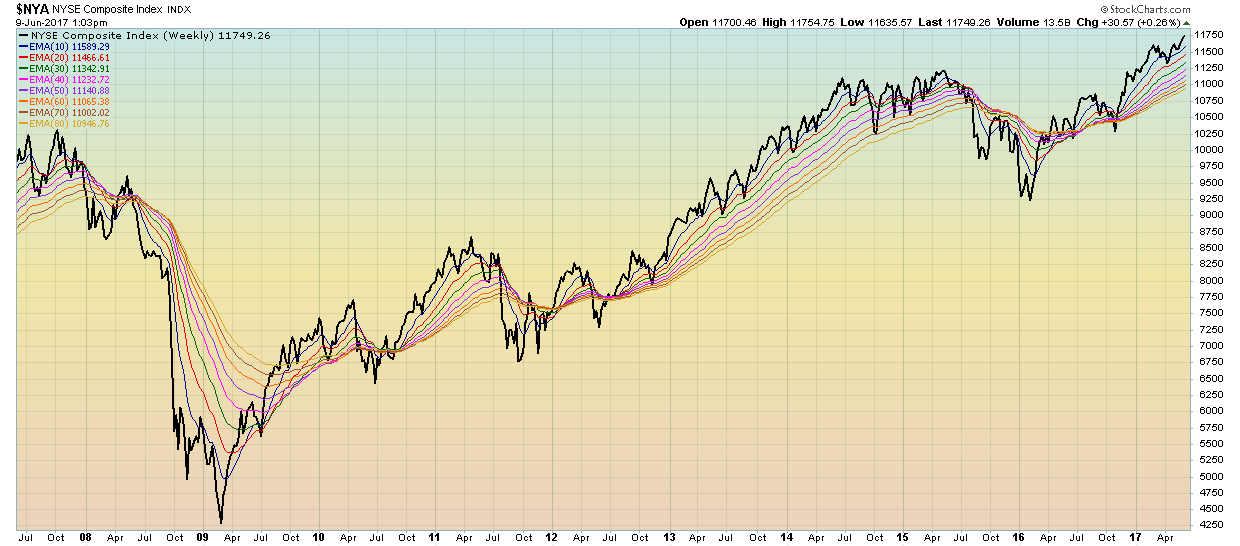
- Merriman’s Question: What is the TREND of the overall Market? Gatis’ Answer: Moving average envelopes clearly show if the trend is up, sideways or down.
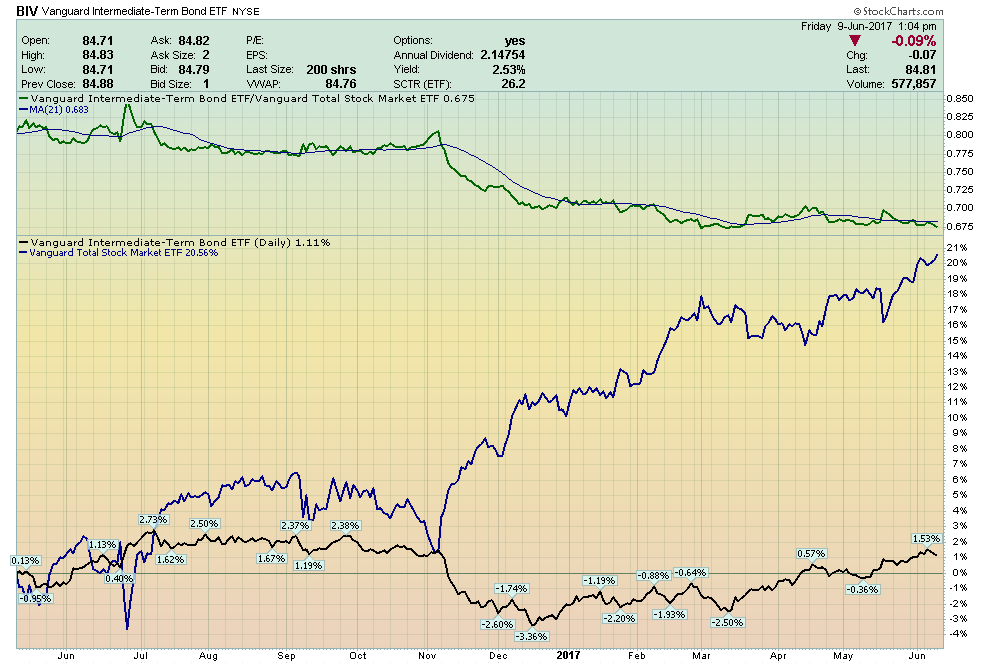
- Merriman’s Question: Is the market favoring BONDS or STOCKS? Gatis’ Answer: The performance chart shows Intermediate-Term Bonds (BIV - black line) versus Vanguard Total Market (VTI - blue line). The green line shows a ratio — if it trends down, bonds are underperforming. If it trends up, bonds are outperforming stocks.
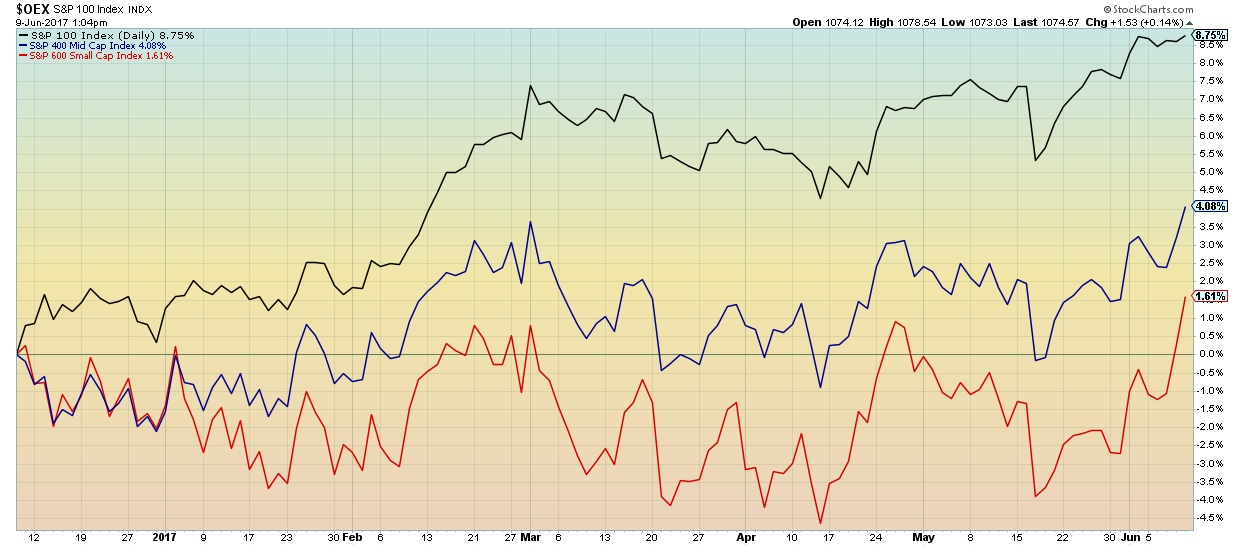
- Merriman’s Question: Is the market favoring Large, Mid or Small Cap Stocks? Gatis’ Answer: The performance chart (showing percentage gains) clearly shows the Large Caps (black line) outperforming Mid (blue line) and Small Caps (red line).
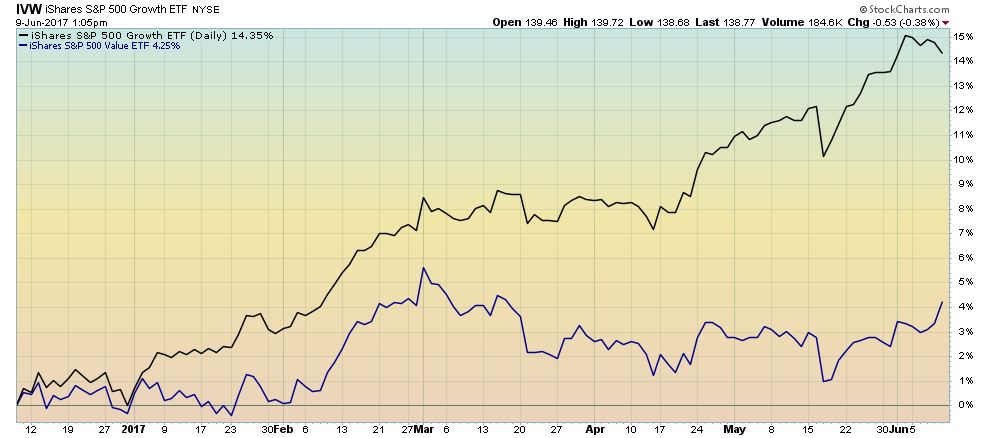
- Merriman’s Question: Is the market favoring Growth Stocks or Value Stocks? Gatis’ Answer: The market is favoring Growth Stocks (IVW - black line) over Value Stocks (IVE - blue line) by a margin of 16% to 5% gain over the past six months (feel free to change the timeframe to suit your personal investing horizon).
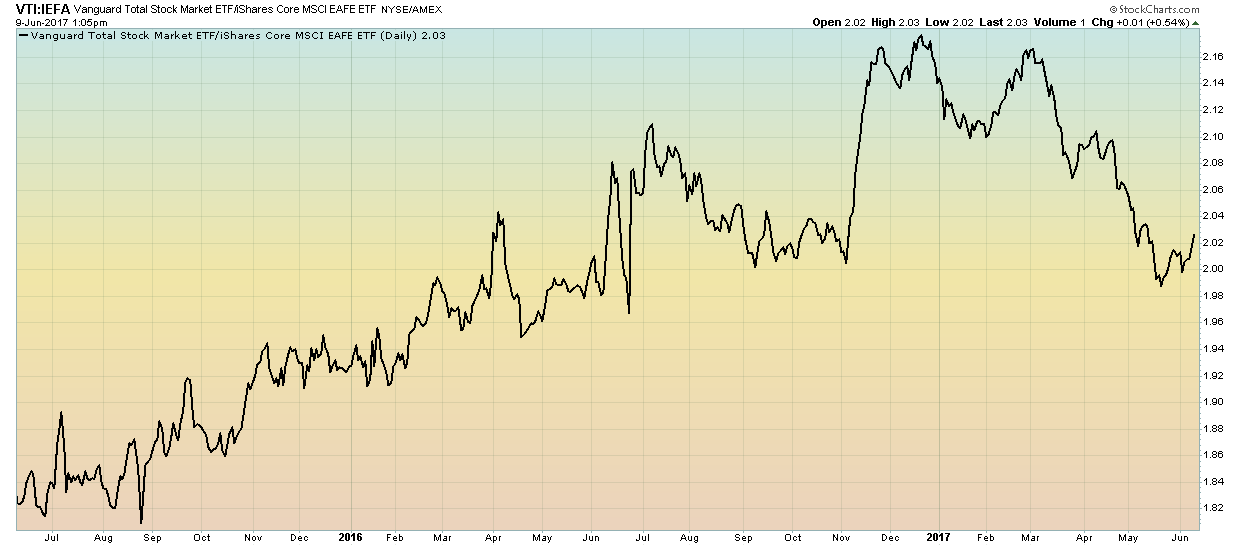
- Merriman’s Question: Are global markets favoring the USA or International Equities? Gatis’ Answer: Vanguard Total Index (VTI) is all USA equities. The iShares CORE MSCI EAFE Index (IEFA) is an index that tracks large, mid and small cap stocks (like VTI does in the USA) in Europe, Australia, and the Far East. The chart is simply a ratio of VTI over IEFA. When the trend is up, the USA (and VTI) are outperforming. When the trend is down, the USA is underperforming, IEFA is outperforming, and therefore International is more attractive.
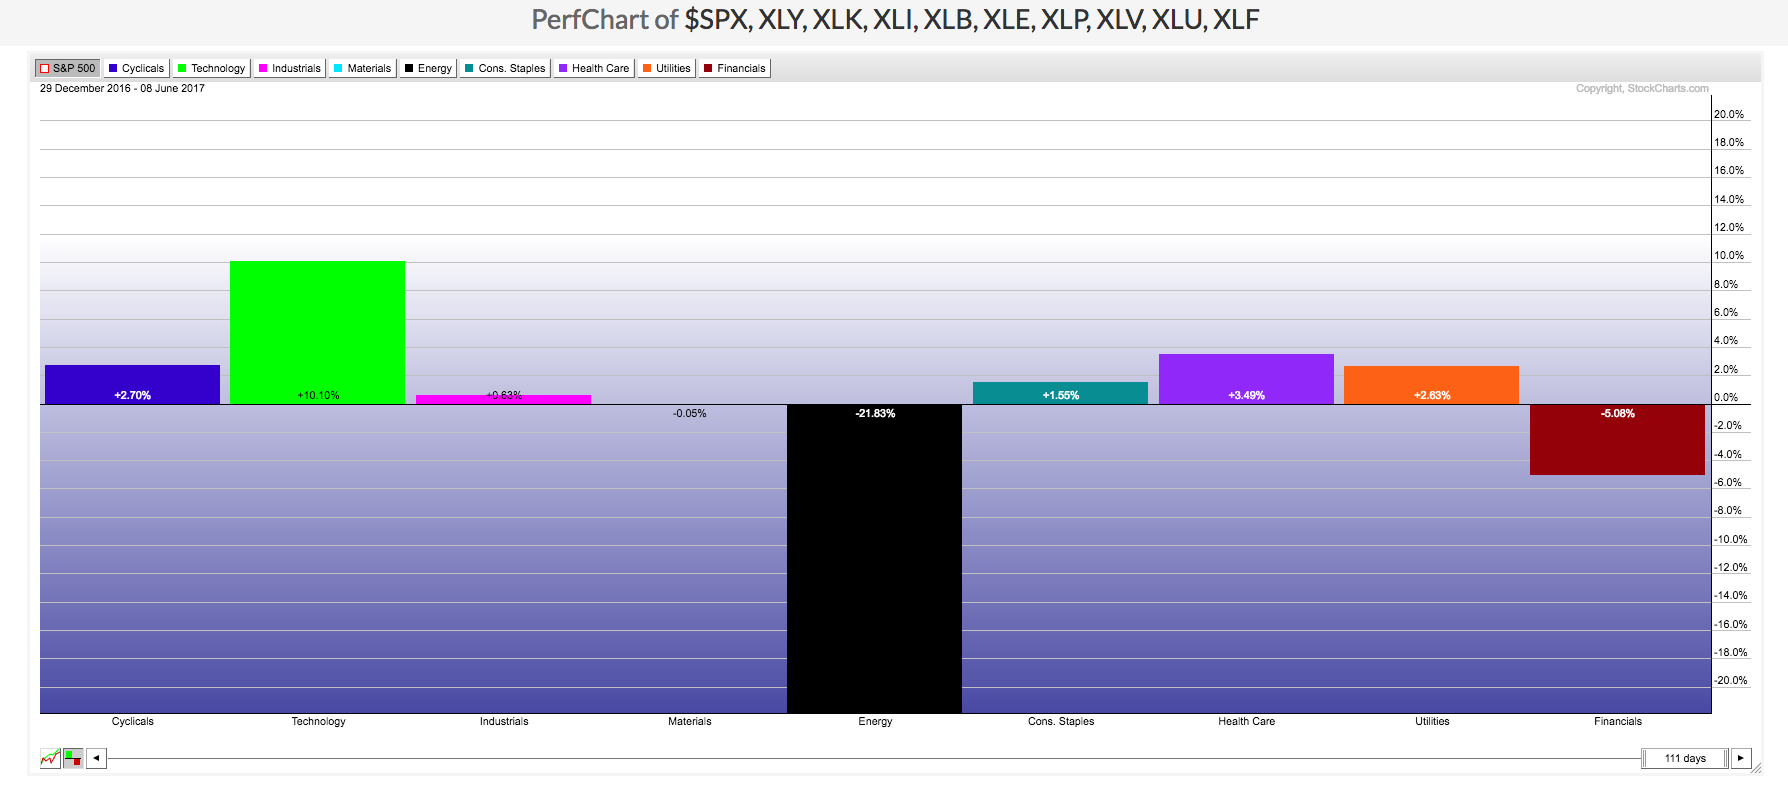
- Merriman’s Question: Which Sectors are the most appealing this year? Gatis’ Answer: The market is divided into nine major sectors. Year-to-date, the chart tells you that you want to be in Technology (XLK) and you want to avoid Energy (XLE).
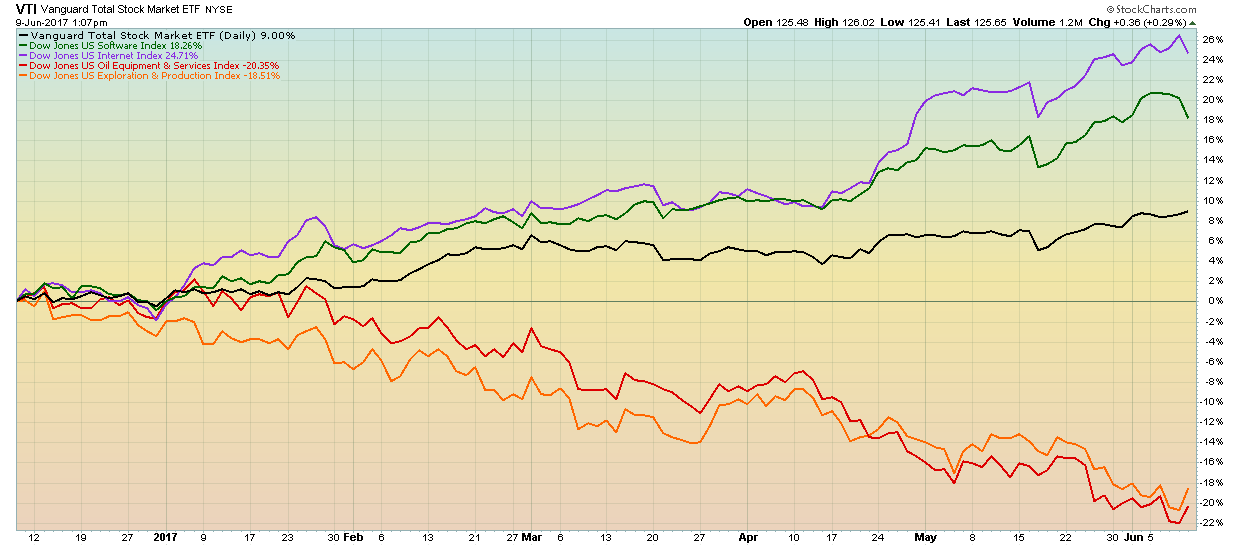
- Merriman’s Question: Which Industries are in favor? Gatis’ Answer: Dow Jones divides the market into over 100 Industry Groups. For example, Industry Groups such as Pharmaceuticals, Biotech and Medical Equipment, make up the larger Healthcare Sector (XLV). The chart clearly shows that the Internet and Software Industry Groups are outperforming the market (VTI), and likewise, oil equipment and energy exploration are to be avoided.
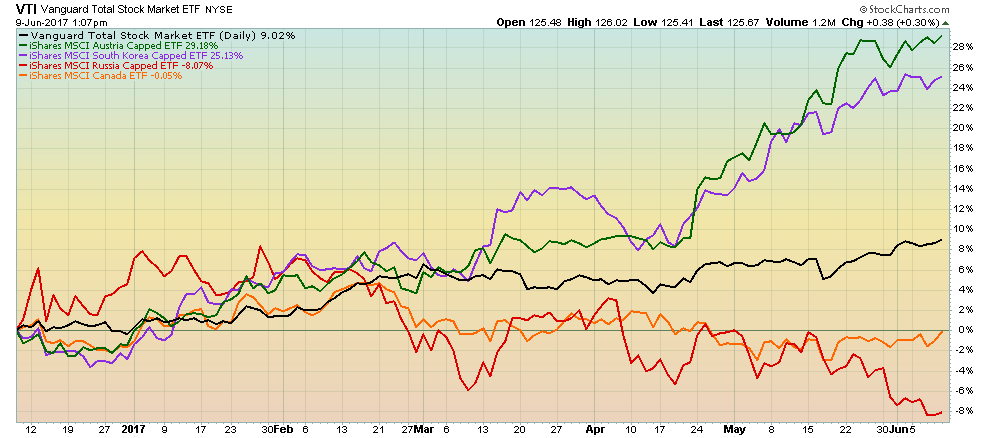
- Merriman’s Question: Which countries are most appealing for investment? Gatis’ Answer: There are over 50 country-specific ETF funds traded in the USA. The chart below clearly tells us that Austria and South Korea are market darlings, and that Russia and Canada are not (note that the later two are heavy commodity-based economies).
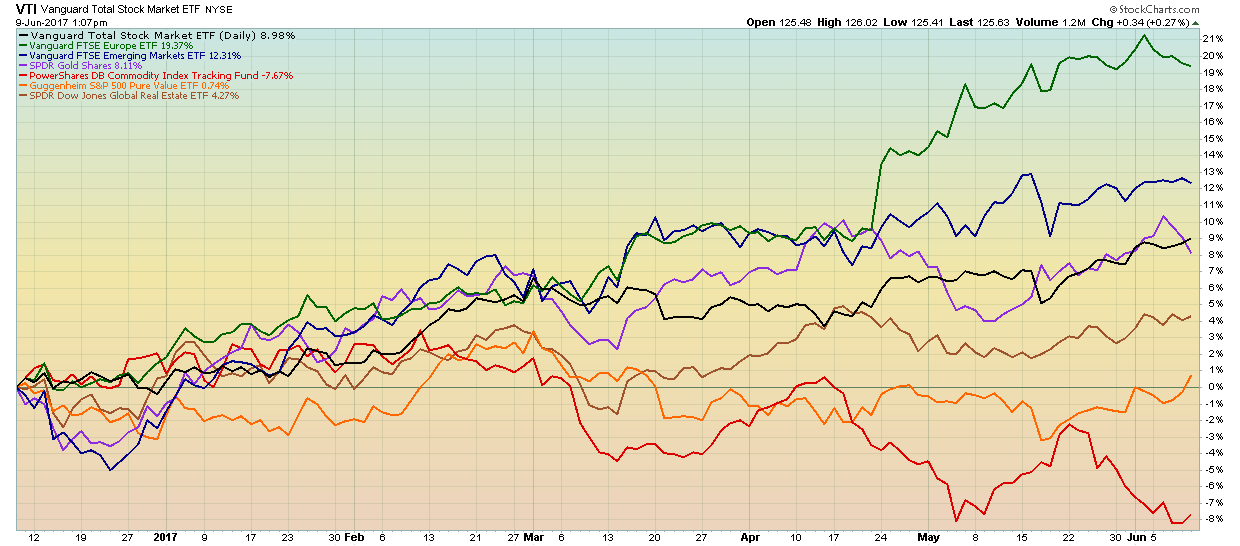
- Merriman’s Question: Which asset classes should I own? Gatis’ Answer: For simplicity and the sake of argument, let’s assume your entire portfolio is only the following seven asset class. Europe (VGK); Emerging Markets (VWO); Gold (GLD); USA Total Market (VTI); Global Real Estate (RWO); S&P 500 Value (RPV); and Commodities (RWO). Year-to-date, you can easily see those asset classes you should be favoring and those you should not be favoring. The market is speaking to you. Asset allocation determines your bottom line. Listen!
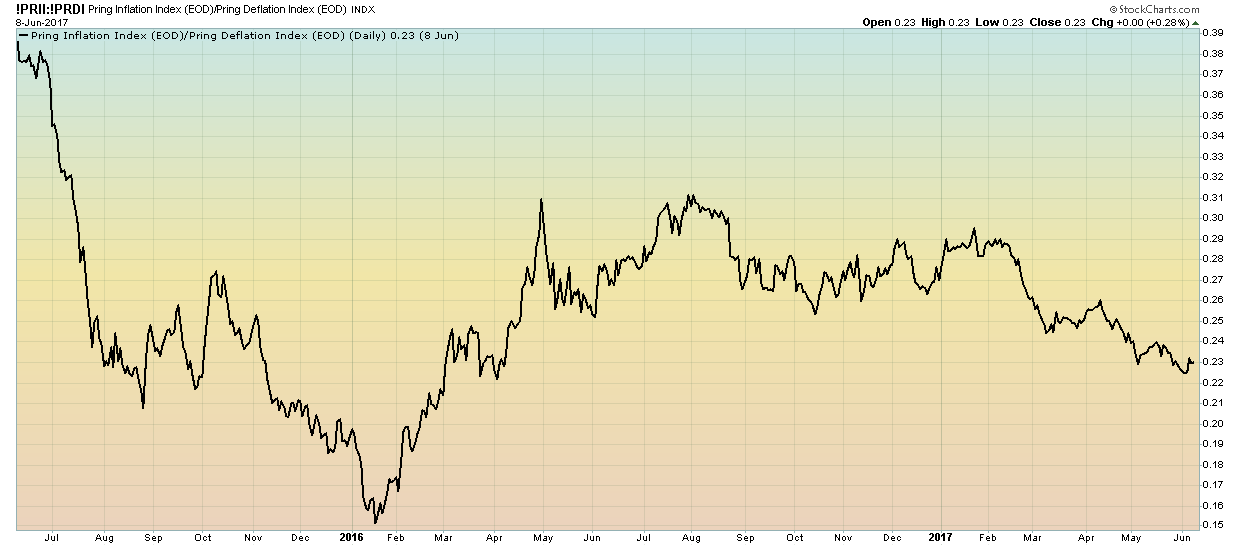
- Merriman’s Question: Is the market suggesting inflation or deflation ahead? Gatis’ Answer: Martin Pring’s inflation index (!PRII) consists of equities that benefit from rising commodity prices, such as mines and energy stocks. His deflation index (!PRDI) consists of industries such as banks, insurance companies and utilities that tend to outperform in weaker economic conditions. The chart is a simple ratio. A rising ratio is inflationary and a declining one indicates a deflationary environment.
To wrap up, there are two paramount conclusions that both Paul Merriman and I agree upon and endorse for individual investors. First, asset allocation is worthy of your attention and indispensable to your success as an investor. Secondly, you must know the answers to key fundamental investing questions with respect to the current stock market in order to ensure you’re in the right place at the right time to make money.
Finally, I’d like you to imagine that, if in two minutes time you now answered these ten crucial questions, just envision what you’d achieve in ten minutes time with the full ChartPack. It will simply allow you to use your precious time judiciously and keep more of your money in your pocket.
Trade well; trade with discipline!
- Gatis Roze, MBA, CMT
- Author, Tensile Trading: The 10 Essential Stages of Stock Market Mastery (Wiley, 2016)
- Presenter of the best-selling Tensile Trading DVD seminar
- Presenter of the How to Master Your Asset Allocation Profile DVD seminar
- Developer of the StockCharts.com Tensile Trading ChartPack


