 A note to my readers: It is with great pride that I have written The Traders Journal blog every week since 2012 — 52 weeks a year. I am deeply grateful for the support and loyal following of all my readers throughout that time. However, I must announce that today marks the end of my writing blogs on a weekly basis. From here on and with Grayson’s help, I will publish blogs on the more leisurely schedule of once every two weeks.
Having said that. let’s pick up where we left off with Action Practice #21. My regular readership will know that a cornerstone of our book and the Tensile Trading methodology is to take advantage of probabilities based on the stock market’s “Law of Groupings”. In our book, we often refer to it as the “sisters strategy”, and we describe how best to apply it in five of the ten stages of Stock Market Mastery. I’ve also written a number of blogs on the topic.
One of the most essential elements in taking full advantage of positive probabilities is to understand how to assemble the most appropriate collection of “sisters”, whether they are sister stocks, sister ETFs or sister mutual funds. Doing this correctly yields benefits that carry through all five stages of:
- Market analysis
- Stalking
- Buying
- Monitoring
- Selling
Those of you who have downloaded the Tensile Trading ChartPack know that the foundation of every ticker symbol we own is supported by a specific ChartList populated with the most appropriate “sister” equities, ETFs or mutual funds. So how do we accomplish this with the three tickers from Action Practice #21? Here’s a hint: you should refer to other resources such as Investors Business Daily (IBD), NASDAQ.com, ETF.com and Morningstar.
Individual Stock — Lending Tree, Inc. (TREE):
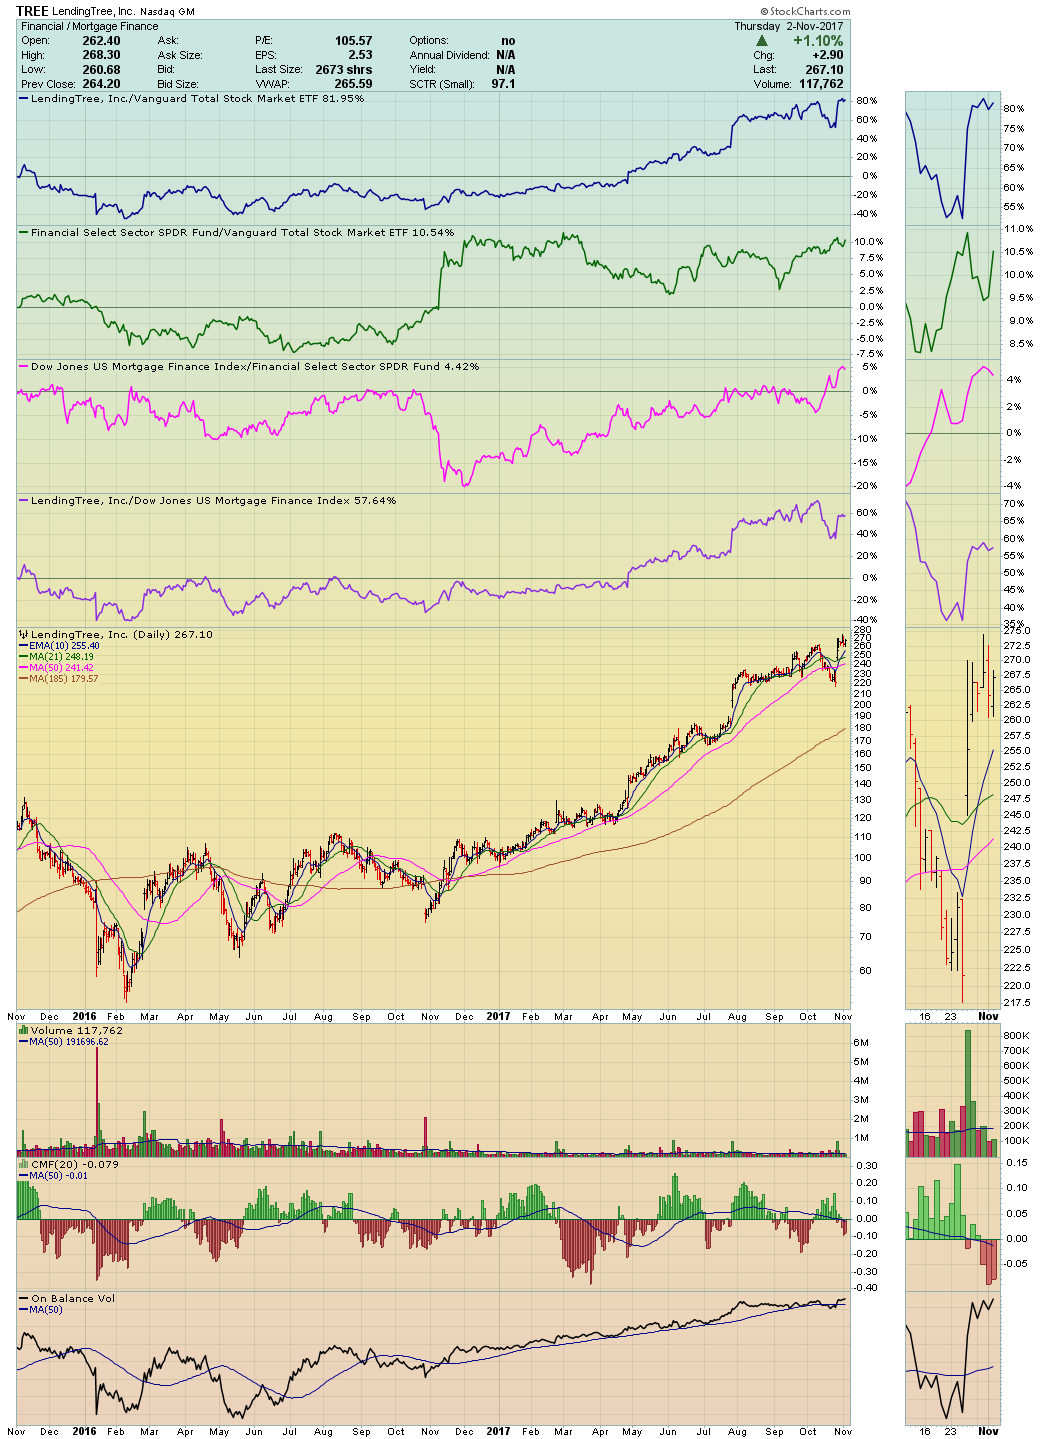
To begin assembling your ChartList, the easiest first step is to simply plot a chart of TREE using the ChartStyle pull-down menu. At the bottom of that menu, you find my name “Gatis Roze” which generates the Tensile Trading chart we’re looking for. With one click, you can now tell instantly:
- How the equity is performing relative to the entire market (TREE vs VTI)
- Not only to which sector TREE belongs (Financials Sector - XLF), but how this sector is performing relative to the market (XLF vs VTI) as shown clearly on the chart.
- The next chart below shows not only the Industry Group for TREE (Dow Jones US Mortgage Finance - $DJUSMF), but how this Industry Group is performing relative to its Sector. A strong Industry Group in an outperforming sector increases positive probabilities.
- Finally, the chart below compares how TREE is performing relative to its sister stocks in the Mortgage Finance Industry Group (TREE vs $DJUSMF).
Now that we know to which Sector and Industry Group our equity TREE belongs, the next step is to select appropriate sister stocks. You want to be sure to pick sister stocks which are the most similar to Lending Tree historically (both Fundamentally and Technically). The four easiest sources are the following:
- StockCharts.com lists all the sister equities in the Dow Industry Group ($DJUSMF).
- Investors Business Daily (IBD) has a wonderful Stock Checklist that provides a list of competitors for Lending Tree.
- NASDAQ.com also has a competitors tab.
- morningstar.com under the stocks tab.
So now you have the components to assemble a powerful ChartList to track Lending Tree, Inc. (TREE).
ChartList Entries (ChartPack users - compare this to ChartList #740):
- A chart of TREE saved in the Tensile Trading Chart Style “Gatis Roze”.
- A chart of TREE to show more detailed money flow and momentum in candle volume mode.
- A PerfChart showing TREE, the market (VTI), its Sector (XLF), its Industry Group ($DJUSMF), and three sister stocks of your choosing (ESNT, NMIH and AGM).
- A chart of the Sector alone — XLF.
- A chart of the Industry Group alone — $DJUSMF
- Individual charts of the three sister stocks — ESNT, NMIH and AGM.
With such a detailed and carefully populated ChartList as this, you will seldom get blindsided with respect to Lending Tree, Inc. (TREE).
 ETF — iShares Core S&P Mid-Cap (IJH):
For mid-cap exposure, I like IJH versus its competitors because of its large asset base, its significant trading volume (which yields tighter bid-ask spreads and good liquidity), and of course, its very low expense ratio (0.07%).
My go-to resources for researching sister ETFs for IJH are both ETF.com and morningstar.com. Assembling a family of equities for the IJH ChartList is much more straightforward than for Lending Tree. The five competitors jump out relatively quickly — MDY, IVOO, IVO, IWR, and SCHM. Whether you wish to use all five is your call.
The last step in populating your IJH ChartList is to include the five largest individual stock holdings — CDNS, TFX, MSCI, TTWO and TRMB. I do this out of routine and habit. In this case, IJH has 400 holdings and the top five do not account for a large percentage of the portfolio. Nevertheless, it’s a good routine that I continue to embrace. In the Tensile Trading ChartPack, ChartList #760 is the example for the Healthcare Sector ETF (XLY) which would be most similar to this example for IJH.
So there you have it — a perfectly populated ChartList for your IJH mid-cap ETF holding.
Mutual Fund — Oakmark International Investor (OAKIX):
If you invest in mutual funds, I would suggest you pay a few bucks and subscribe to morningstar.com digital. Yes, you can go to a public library and use it there. Yes, your broker probably offers a vanilla version. But being able to use the website’s X-ray portfolio function alone is worth the price of admission.
Yes, your broker probably offers a vanilla version. But being able to use the website’s X-ray portfolio function alone is worth the price of admission.
Back to building ChartLists. For OAKIX, the first step would be to use Morningstar’s “Find Similar Funds” tool. It will generate a list of potential sister funds. My personal caveat in the foreign funds arena is this. I hold both asset baskets as part of my portfolio. Those being two types. Global Funds — those funds which by my definition invest across the entire planet and generally hold 20% or more in North American equities. And also, International Funds — those which generally focus more on equities outside the USA but which may hold 20% or less in North American equities.
In my portfolio, Global Funds are therefore separate from International Funds. Because OAKIX holds less than 6% in North American equities, it falls into the International Asset Basket. Therein lies the need to do some filtering when choosing the most appropriate sister funds.
Using morningstar.com to show me each funds regional exposure, I adopt MINIX and JOHIX as sister funds. I also include an ETF — EFAV. Since our family of funds holds a fair percentage of Japanese, European, UK and American equities, I also include these foreign indexes — $NIKK, $EUR, $FTSE, and VTI.
Since the top three holdings of OAKIX account for nearly 14% of the porfolio, I also include the following in the ChartList: Glendora PLC (GLNCY), Credit Suisse (CS), and Daimler AG (DDAIF). In the ChartPack, refer to ChartList #780 for a similar exercise using the mutual fund Vanguard Healthcare (VGHCX).
And that, ladies and gentlemen, is how you assemble a portfolio of ChartLists that consistently make money when you combine them with the discipline to monitor your ChartLists. No one said it would be easy, but let me assure you that it’s worth the effort.
This Week’s Action Practice:
In the previous 22 Action Practice exercises, we have always focused on charting and technical analysis skills. As I have preached in my seminars, classes, DVDs and book (see Chapter 3 - The Investor Self), the most impactful contributor to your success is determined by your personal behavior as an investor. The alpha and omega of investing resides in you. Yes, it’s mostly about you!
With this in mind, I’m presenting you with the “dandy dozen”. I challenge you to be brutally honest with yourself in answering these twelve essential questions. Let me say upfront that I will be crediting the originator of these questions in the next Action Practice #23. After all, I wouldn’t want to temp you to go to the source and thereby influence your own answers. So put on your Investor Self vest, look in the mirror, and answer these twelve questions as honestly as you are able as they apply to your portfolio and your management of those equities.
- Do you have a written investment plan and goals which you stick to?
- Do your investments align with each of your goals?
- Are you able to evaluate which services you are willing to pay for and those you can do yourself? (Fees matter.)
- Do you have the skill set to choose high probability stocks, ETFs, and mutual funds?
- How do you prioritize and balance management costs and performance for the ticker symbols in your portfolio?
- Have you achieved a balance of your core portfolio with your explore portfolio?
- Are you open to both passive and active management with respect to ETFs and mutual funds?
- Are you patient enough to earn profits?
- Do you let news drive your investments?
- Do you ever say “I’m going to hold on to this investment until it gets back to even?”
- Do you follow Net Asset Value (NAV) as an indicator of total return?
- Do you automatically invest on a regular basis?
There you have it — the dandy dozen. I look forward to revisiting these with you in a few weeks.
Trade well; trade with discipline!
- Gatis Roze, MBA, CMT
- Grayson Roze
- Author, Tensile Trading: The 10 Essential Stages of Stock Market Mastery (Wiley, 2016)
- Presenter of the best-selling Tensile Trading DVD seminar
- Presenter of the How to Master Your Asset Allocation Profile DVD seminar
- Developer of the StockCharts.com Tensile Trading ChartPack


