 Pick the pro league of your choice. You can have the most expensive talent on one team, but without the right organization, routines and strategy, you won’t make the playoffs.(Presently, for example. you might consider the NBA’s Los Angeles Lakers with one LeBron James and friends).
Something similar happens with investors. Being the smartest, most educated high IQ individual in the arena does not guarantee you profits. In fact, hubris often results in the opposite becoming true — based on the fact that those kinds of investors often believe the normal rules of organization, routines and strategies don’t apply to them. That is, until they finally learn that the market humbles everyone equally. The sooner you get your ego out of the way and embrace the realities of your “Investor Self” (chapter 3 of Tensile Trading), the sooner you’ll become a consistently profitable investor.
So for those of you “smarter-than-the-average-bears” out there, stop acting like a giant bi-polar gorilla holding onto your outdated beliefs. It’s much like playing NHL hockey without a helmet. In Darwinian terms, you will soon be taken out of the game.
On the other hand, the stock market is a jigsaw puzzle we’ve solved for you. All those missing pieces are there in the ChartPack. Grayson and I have been using it to trade our accounts for over a decade, and since we made it available to StockCharts.com subscribers in 2013, the thousands of users have contributed mightily to the many muscular enhancements. You provide the discipline. The Tensile Trading ChartPack dashboard will provide the organizational roadmap and specific ChartLists of routines to follow. So here are just a few of this quarter’s updates. It should be noted that many minor updates occur continuously between these major quarterly updates, and we only highlight the more significant ones in these blogs.
#10.1 — Permission to Buy — Trend
This is an example of how small improvements contributed by the user community and incorporated into the ChartPack have rendered it more powerful each quarter since we first released version 1.0 in 2013. Recently, a longtime user pointed out that we are all conditioned to think green lights mean go, yellow lights mean caution, and red lights mean stop. She suggested we incorporate that visually into the Daryl Guppy Moving Averages chart. Visually, the chart now starts by plotting short term averages in green, then blue, brown, orange, gold, purple, pink and finally the last MA in red. Visually, it works nicely.
#10.4 —Bullish & Bearish Dashboard of 16 Longterm Indicators
This essential collection of 16 historically significant charts illustrates the weight of fundamental market indicators, such as the Unemployment Rate, Industrial Production, S&P 500 Earnings, and Leading Sectors, as well as Technical Indicators such as momentum, the volatility index and a number of breadth indicators. Together, they provide a powerful picture of the markets and the balance of evidence for either a bullish or bearish scenario.
There are a couple of enhancements to note on the breadth charts. Chart #4.5 is based on $NYHL and shows the New Highs minus New Lows on the NYSE. Chart #4.96 replaces #4.95 and shows $NYUD. This second breadth indicator shows the total volume of advancing stocks minus the total volume of declining stocks (A/D) on the NYSE. Historically, a rising market making higher price highs which is not confirmed by rising positive A/D volumes becomes susceptible to exhaustion and will turn down.
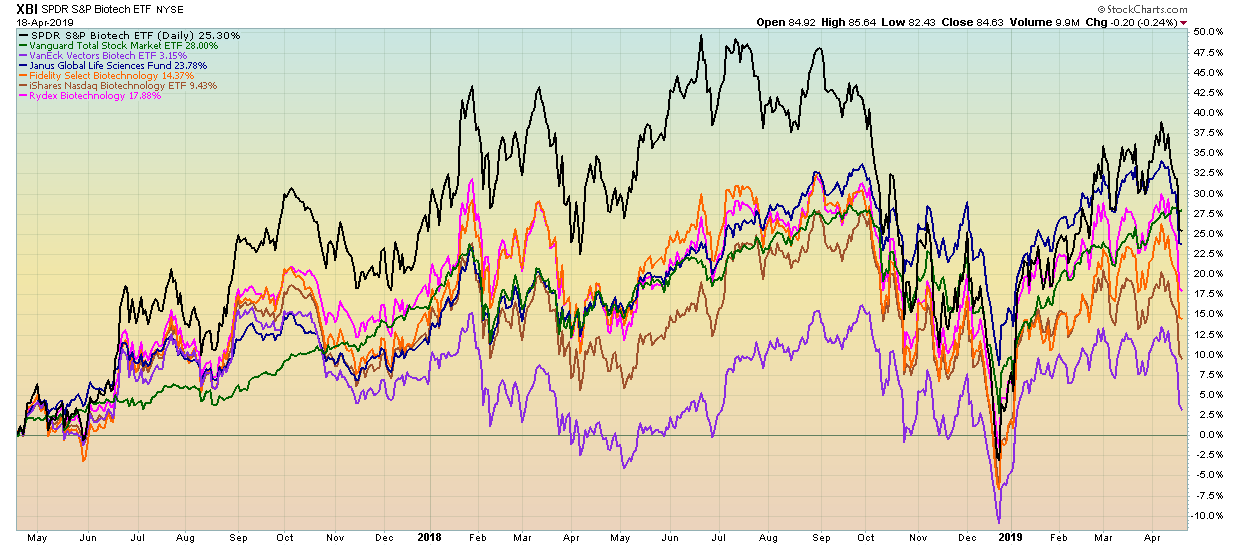
#10.9 —Sample ChartStyles
At our recent Investor Boot Camp, we presented our “Best of Breed” methodology in detail, and it was recommended that we add this chart style to the samples ChartList. We have now done so. In this example, the chart represents one asset class — Biotech. Other asset classes are similar in that the “best” ETF for that asset class is the ticker at the top of the chart and plots in black. The total market (as represented by Vanguard Total Market) VTI is always plotted in green. The balance of the candidates are a mix of the top performing no-load mutual funds and “Best of Breed” ETFs.
The purpose of these “Best of Breed” charts is three-fold:
- When new “champion candidates” present themselves, it’s quick and easy to insert them side-by-side with existing champions to compare performance — thereby answering the question, “can new candidates dethrone the present champions?”
- These “Best of Breed” charts also answer the second question of whether this particular asset class has active mutual fund managers who have proven over time that they are able to outperform their benchmarks and earn their higher expense fees or whether a low cost passive ETF is the champion.
- As part of a monitoring routine, these “Best of Breed” charts point out which asset classes are outperforming the market and deserve more of a financial allocation and which asset classes need to be reduced. Also, within each asset class, it monitors the investors “owned” ticker symbol versus its brothers and sisters in this particular asset class to ensure that the investor remains invested in the “Best of Breed” for each asset class.
#217 — Gold
Gold versus the US Dollar has has a strong inverse relationship historically. We changed the data to weekly (from daily) to make this inverse relationship even more visually obvious.
#420-12 to 420-90 — Fidelity Sector Portfolios
An intriguing trend across the Fidelity portfolios presented itself this past quarter. A significant number of funds reduced their total positions by substantial percentages. For example, the Communications Equipment fund shrank its portfolio size from 60 positions last quarter to 39 as of the latest update. The team behind the Gold fund reduced their position allocation by exactly 50%. Similar moves were noticed in Consumer Discretionary and Computers. Considered in the context of a market that has bounced from a sharp decline in late 2018 and is now trying to test old highs, these total positions reductions are an interesting theme.
Here are a few other quick highlights:
- One stock that appeared across a number of Fidelity funds was Tronox (TROX), a specialty chemicals company that has been trending nicely since the start of 2019. The indicated institutional support here, spread across multiple large funds, could be an important boost to this growing small-cap stock.
- The Energy Service portfolio saw lots of change, with a few big name adds and drops.
- The Industrials portfolio also saw some substantial shifts in the past quarter, with General Electric (GE) returning to the top 10 holdings lists after being dropped last quarter. A few other notable adds and drops in this fund make it a good ChartList to take a closer look at.
Already have the ChartPack? Here's how to upgrade:
- Log in to your account, then visit the "Manage ChartPacks" page (accessible from the bottom of the Members Dashboard or from the "Your Account" page).
- In the table that appears, find the entry for the "Tensile Trading ChartPack" (if you don't see the Tensile Trading ChartPack listed, that means that you haven't purchased it. Click Here to do so now).
- Click the "Re-Install" button next to the Tensile Trading ChartPack to start the update process
The download should take about 15 seconds, after which you can explore the new ChartLists and other updates!
New to the ChartPack? Here's how to install it:
If you'd like to add the Tensile Trading ChartPack to your StockCharts account, Click Here.
Trade well; trade with discipline!
- Gatis Roze, MBA, CMT
- Grayson Roze, Business Manager, StockCharts.com
StockMarketMastery.com
Co-Authors, Tensile Trading (Wiley, 2016)
Co-Presenters, How To Master Your Asset Allocation Profile


