
Investing is like a plumbing game. For this reason, the organization and organization of your ChartLists, along with your routines, matter big time! Figuring out where the funds are flowing and adjusting your piping system accordingly is the key objective. In this case, its money flow which is being piped and must be monitored accordingly. The ChartPack facilitates the visualization of the proper piping and acts like the treasure map locating where the pirates are stashing their golden bounty. It's seldom static for any long period of time. Therefore, the manta is "embrace the changes". The ChartPack is designed to do precisely this.
Here are some of the updates and changes to the ChartPack over the past quarter. Our thanks once again to the user community for your suggestions and betterments.
#10.4 – Bullish & Bearish Dashboard
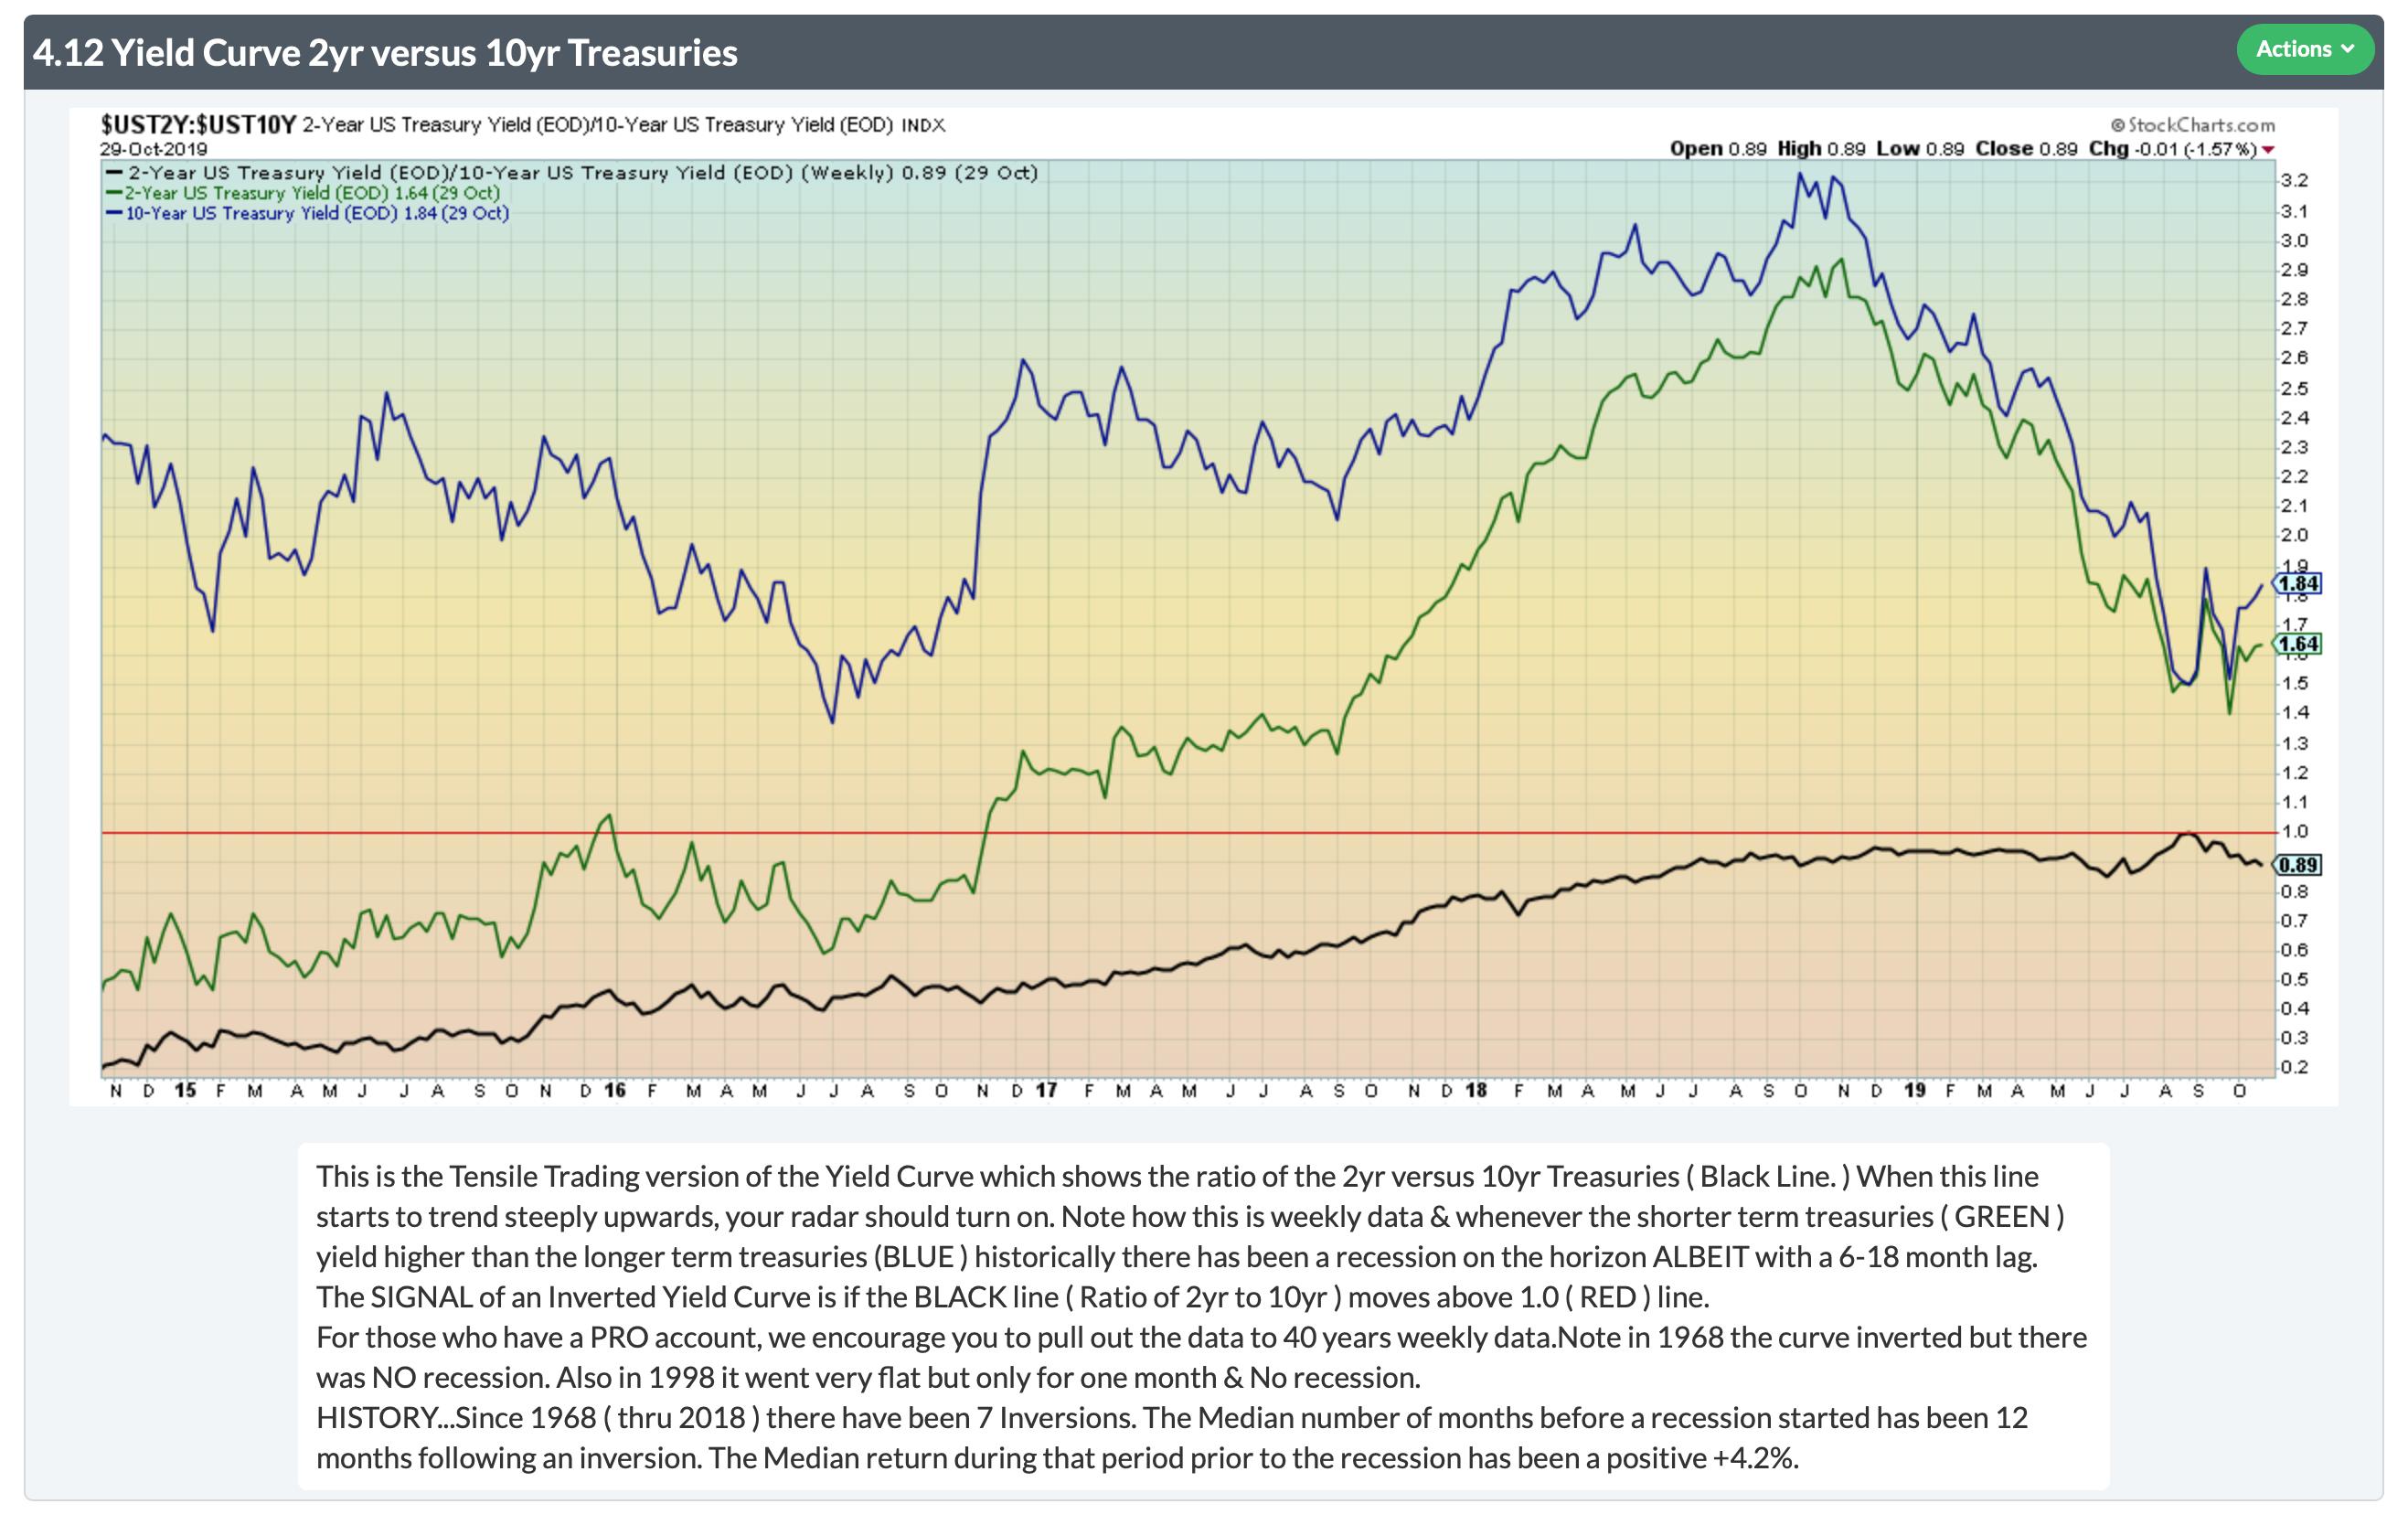
We regularly write about this ChartList since it provides a mountain of insights. The essential message is always the same: don't miss the comments portion below all the charts. For example, on Chart 4.12 Yield Curve, we added historical notes about lead-times and returns from the time the curve inverts to the beginning of a recession. Don't overlook that commentary.
#217 – Gold & Currencies
Review the chart of gold versus all the major global currencies. It suggests that bankers are losing faith in their own currencies and bidding up gold as a store of value. Again, don't overlook the comments section below the charts.
#401 to #413 – Sector ChartLists
Grayson and I have a great deal of enthusiastic company in the user community for the contribution that "Sector Analysis" makes to one's investing success. An intimate ongoing familiarity of what's going on in these 11 sectors yields huge dividends in all your market endeavors. That being the case, we've added six tickers to their respective sector-specific ChartLists to help facilitate your analysis.
- Consumer Staples — added FSTA
- Industrials — added ITA since it is such an immense group
- Real Estate — added IYR as well as ITB and XHB. These latter two are home builders and construction. Some rating services like to position them under the consumer discretionary sector. We feel they're more appropriate in the Real Estate Sector. But having said that, you should decide for yourself. It's not difficult to reassign them in your personal ChartLists.
- Technology — added FDN
Remember, the S&P 500 is divided into 11 investable sectors. Yes, they all provide diversification, transparency and all-day tradability. But beware of the composition of each sector. For example, the Technology Sector (XLK) has its top two positions accounting for 37% of the portfolio. Significantly different from the Industrials Sector (XLI) which has its top two holdings accounting for less than 14% of the portfolio. The point being that if you hold XLK, then monitoring Microsoft and Apple is more impactful than if you hold XLI and monitor Boeing and Honeywell.
#420-12 to 420-90 — Fidelity Sector Funds
Let's start with the big picture observations about how these 43 Sector Funds are collectively allocated this quarter.
- Large Caps – 66%
- Mid Caps – 25%
- Small Caps – 9%
Note: recent Morningstar research proves that managers add alpha (out-performance) most consistently in both the mid-caps and small caps arenas.
–––––
Fidelity's sector funds are split pretty evenly amongst Value, Core and Growth — i.e. 35%, 36% and 29%
–––––
Between US and Foreign, it's very US-oriented — 88% to 10% foreign and the balance in cash.
–––––
On a performance basis, 21 individual funds outperformed the S&P 500 (SPY) this quarter, led by these big five (through 10/25/19).
- Computers: +9.13%
- Construction: +9.02%
- Wireless: +8.94%
- Semiconductors: +8.02%
- Pharmaceuticals: +6.27%
–––––
The four Sectors over-allocated by Fidelity relative the S&P 500 allocations are:
Basic Materials
Real Estate
Communication Services
Utilities
–––––
The stocks owned by the most number of Sector Fund managers were:
- Alphabet (GOOGL) – held by 9 funds
- Visa (V) – held by 6 funds
- MasterCard (MA) – held by 5 funds
- A tie between Apple (AAPL), AT&T (T), and Verizon (VZ) – held by 4 funds each
–––––
Each quarter, Grayson and I expend the most energy on the Fidelity Sector Funds analysis portion of the ChartPack because, frankly, this is there we personally get the "biggest bang for our buck" as investors. Here are six key reasons why Grayson and I invest our time in dissecting the 43 Fidelity Select Sector Funds each and every quarter.
(1)
The next big stock winners have historically appeared first in these focused sector funds. This has been our experience over the past decade.
(2)
The "weight" of Fidelity's commitment to a particular stock can be identified. The bigger the position, increasing over a number of sector funds gives us confidence and is worthy of our attention.
(3)
Likewise, our radar goes up when we witness a decreasing commitment in certain stocks versus the previous quarter.
(4)
With all 43 Sector Funds in one ChartList, it's easy to rank performance and identify strengths and weaknesses each day, week or month depending on your personal routines. Sector analysis always matters. It's money in the bank.
(5)
Here's an example. If Construction and Housing (FSHOX) is outperforming the market, as investors we can dig into the funds individual holdings and consider the stocks Fidelity deems to be the best-of-the-best, such as Home Depot (HD), DR Horton (DHI) or PulteGroup (PHM).
(6)
As a learning tool, it's been very very informative to analyze the stock charts of equities that Fidelity is either accumulating or distributing. Combine this with Bruce Fraser's blog, "Wyckoff Power Charting", and you have the equivalent of X-ray market vision! You can see the buying and selling campaigns and witness the execution used by big money managers like Fidelity.
–––––
The bottom line is that your time is well spent on understanding the shifting market landscape each quarter, and these sector funds and ChartPack are your vehicle.
Here are a few additional highlights from this quarter's Fidelity sweep:
- The Air Transportation Portfolio (#420-12) was particularly active this quarter with 4 of its top 10 holdings changed. Among a few other changes, the management team here swapped one major airline for another and took a substantial position in TransDigm (TDG), an aerospace company that has been trending beautifully and outperforming the market by a healthy margin.
- Another highly-active fund was the Construction and Housing Portfolio (#420-28). This is one to take a closer look at when you re-install (or purchase) the ChartPack updates for this quarter.
- A certain Seattle-based coffee chain was picked up by the Consumer Discretionary Portfolio (#420-30), which has coincided with a nice run in the stock. After a strong uptrend, SBUX is now pulling back to its 200-day Moving Average. This is a great example of how the Fidelity sweep can yield profitable results, uncovering strong stocks with equally strong institutional support that are making important technical moves. If you're playing a bit of the longer-term game, take a look at SBUX here as it resets on the 200-day.
- Lastly, the Telecommunications Portfolio (#420-84) and Wireless Portfolio (#420-90) both added big positions in major video game creator. On the chart, the stock pulled back after making new highs last year, but it appears that some support has been found and an uptrend may be forming here. Take a look at these two ChartLists and dig into the new buy.
Already have the ChartPack? Here's how to upgrade:
- Log in to your account, then visit the "Manage ChartPacks" page (accessible from the bottom of the Members Dashboard or from the "Your Account" page).
- In the table that appears, find the entry for the "Tensile Trading ChartPack" (if you don't see the Tensile Trading ChartPack listed, that means that you haven't purchased it. Click Here to do so now).
- Click the "Re-Install" button next to the Tensile Trading ChartPack to start the update process
The download should take about 15 seconds, after which you can explore the new ChartLists and other updates!
New to the ChartPack? Here's how to install it:
If you'd like to add the Tensile Trading ChartPack to your StockCharts account, Click Here.
Trade well; trade with discipline!
- Gatis Roze, MBA, CMT
- Grayson Roze, Business Manager, StockCharts.com
Co-Authors, Tensile Trading (Wiley, 2016)
Co-Presenters, How To Master Your Asset Allocation Profile
Trade well; trade with discipline!
Gatis Roze, MBA, CMT
- Author, "Tensile Trading: The 10 Essential Stages of Stock Market Mastery" (Wiley, 2016)
- Developer of the "Stock Market Mastery" ChartPack for StockCharts members
- Presenter of the best-selling "Tensile Trading" DVD seminar
- Presenter of the "How to Master Your Asset Allocation Profile DVD" seminar
Chart on, my friends.
Grayson Roze
- Director of Operations, StockCharts.com
- Author, Trading For Dummies (Wiley, 2023)
- Author, Tensile Trading: The 10 Essential Stages of Stock Market Mastery (Wiley, 2016)
- Co-Founder, StockMarketMastery.com
- Twitter: @GraysonRoze