 What a week to be back hosting another episode of "Your Daily Five". As I'm sure you heard, we held a major LIVE event on StockCharts TV yesterday - "Introducing StockChartsACP: The Future of Technical Analysis". Chip, Dave and I sat down for an exclusive series of in-depth discussions with charting legends like John Murphy, Ralph Acampora, Martin Pring, Larry Williams, Arthur Hill, Dave Landry, Mish Schneider and others. It was a wonderful opportunity to hear their perspectives on how charting and technical analysis have evolved over the years and, of course, dig into the features of ACP to explore how these experts are using the platform in their own approach to today's markets.
It's tough to follow that up with anything of competing excitement, but if there's anything that can come close, surely it's a new episode of "Your Daily Five" – easily one of my favorite StockCharts TV shows!
Check out today's edition of "Your Daily Five" below:
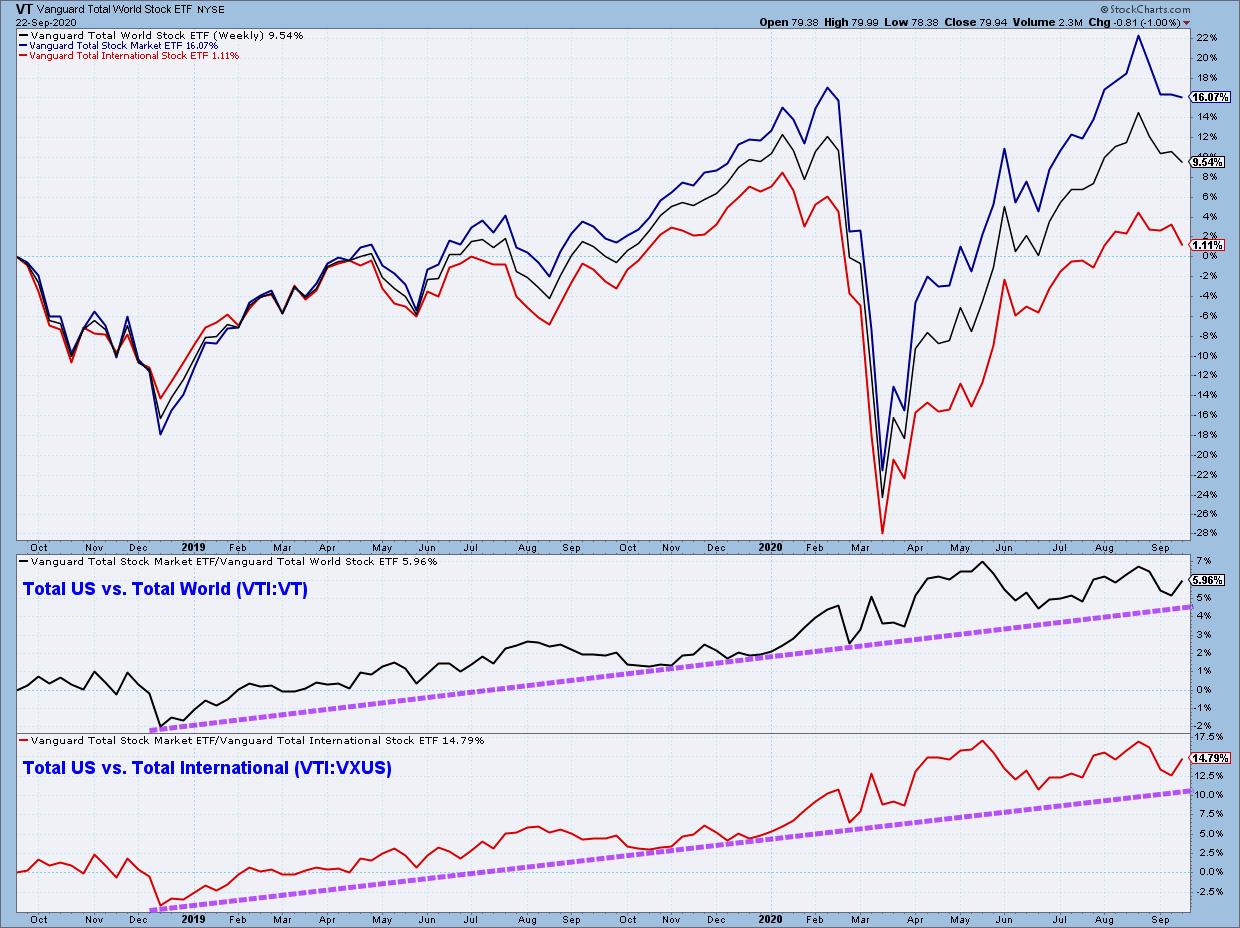
On today's edition, I took a broad, multi-year look at the US Total Market ETF (VTI) vs. the Total World (VT) and Total International (VXUS) counterparts. As you'll see, the ratio charts clearly show that US leadership is continuing, even during the recent pullback.
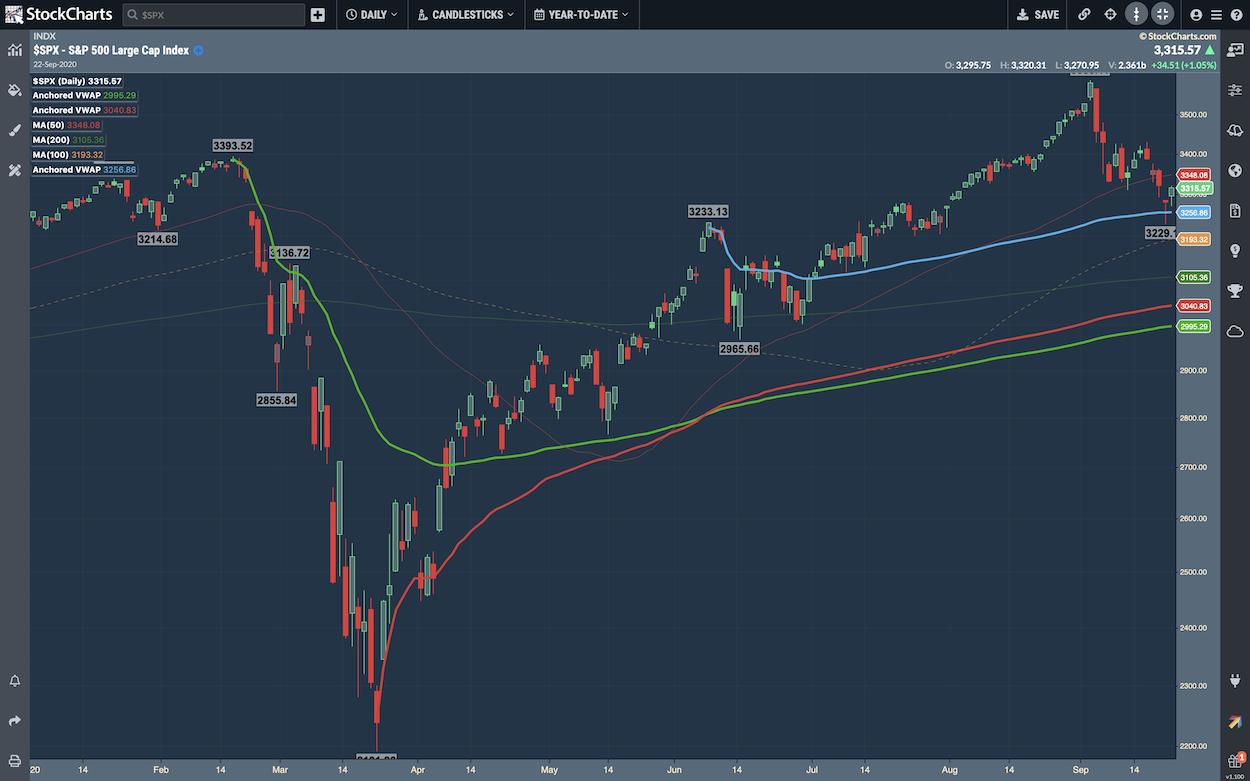
I then pulled up a chart of the S&P 500 with the new Anchored VWAP indicator in StockChartsACP to show a "hidden support" level that I'm watching closely. We'll be detailing a lot more on this exciting new feature of ACP very soon, so stay tuned there – lots of good stuff to come.
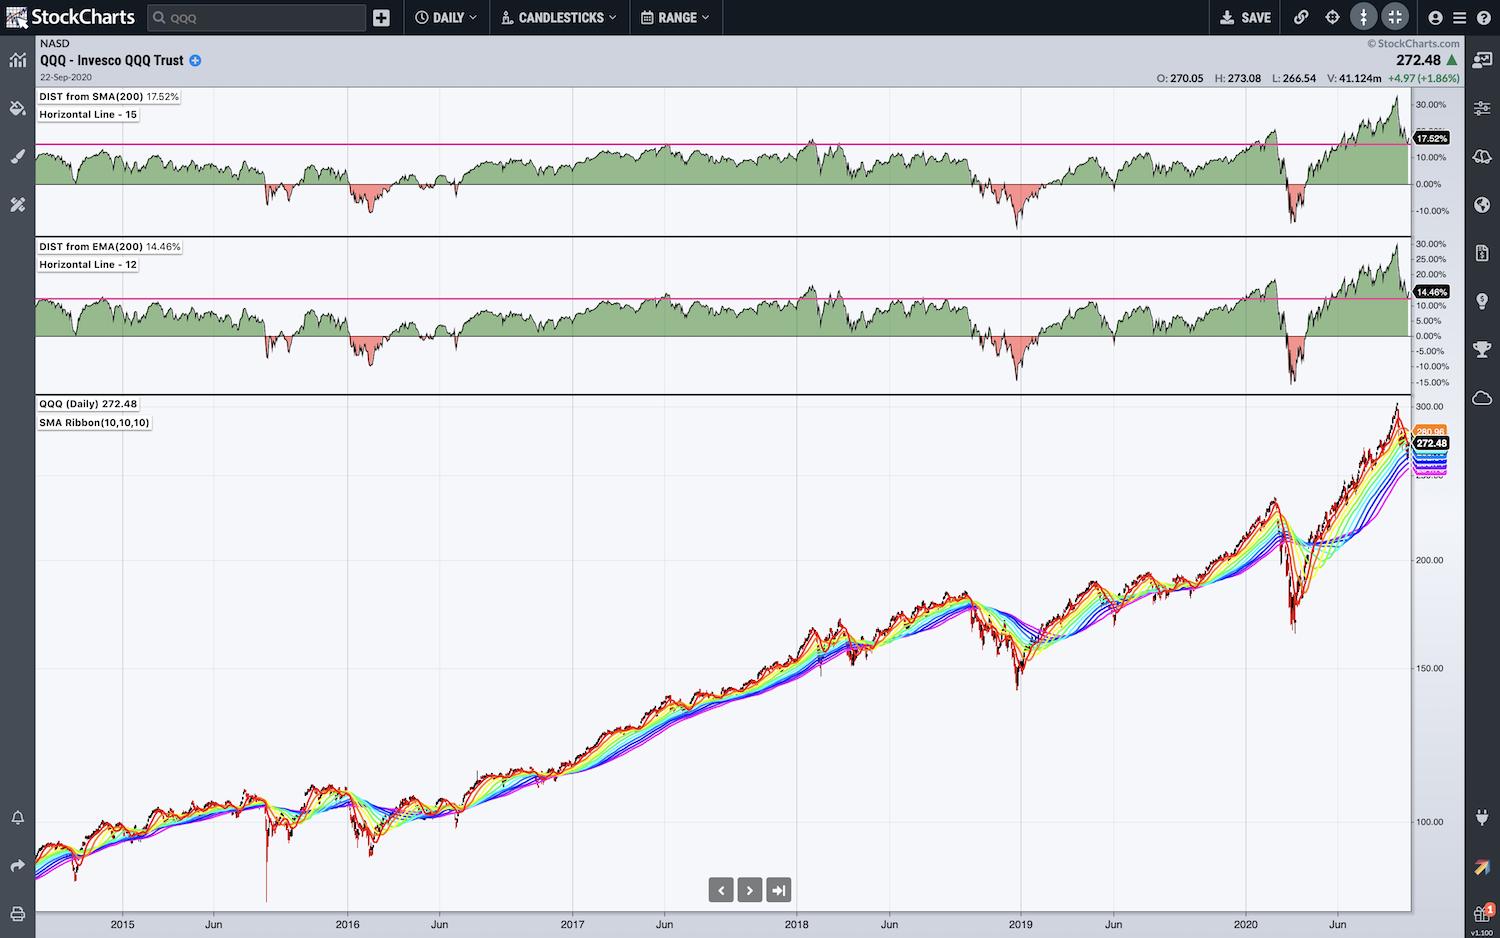
Next up, I took a look at the NASDAQ 100 (QQQ) with a unique Moving Average Ribbon, as well as two "Distance From Moving Average" panels – one showing the distance from the 200-day Simple Moving Average, and the other showing the distance from the 200-day Exponential Moving Average. What we can see on that chart is that the index remains highly extended above its 200-day SMA and EMA.
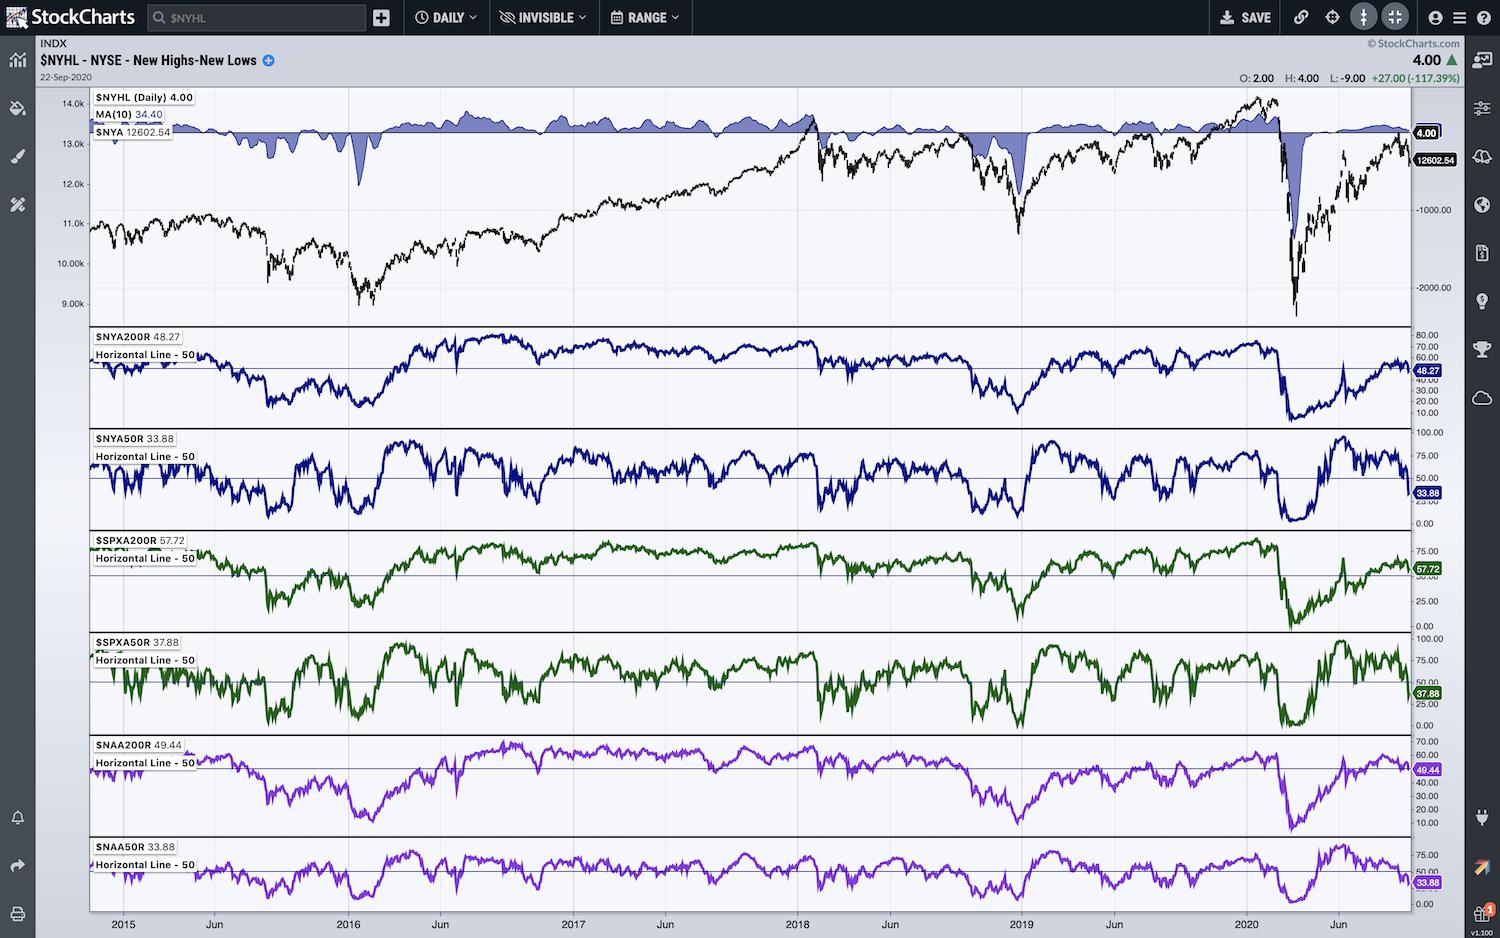
Of course, I had to dive into my classic breadth chart to take a look at how the NYSE, the S&P 500 and the NASDAQ are all holding up. As we see tests of the all-too-crucial 50% level in those breadth measures, I'm keeping a close eye on this chart.
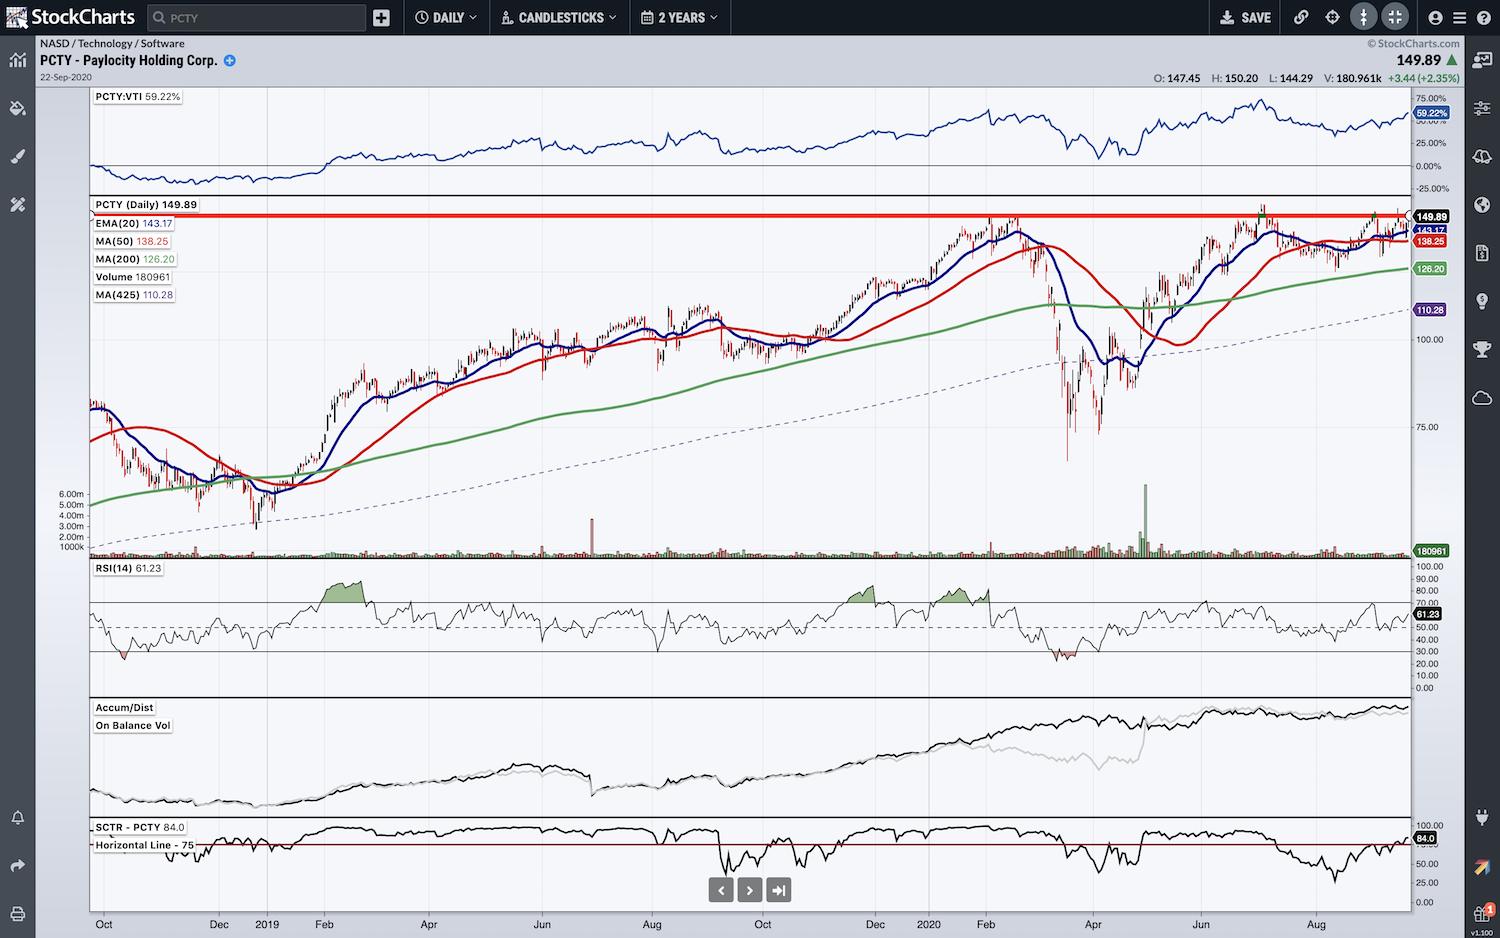
And finally, I shared an individual stock that has my attention at the moment – PCTY (Paylocity). As you'll hear, I'm watching for a breakout above the 150 level and up to new highs, but I love the accumulation this stock is showing and am pleased to see it rising up the SCTR ranks too. Great relative strength in recent weeks, and if the breakout can make it, I'd expect PCTY to become a real runner.
Money In, Eyes Open.
- Grayson Roze
VP of Operations, StockCharts.com
Author, Trading for Dummies (Wiley, 2017)
Author, Tensile Trading: The 10 Essential Stages of Stock Market Mastery (Wiley, 2016)
Chart on, my friends.
Grayson Roze
- Director of Operations, StockCharts.com
- Author, Trading For Dummies (Wiley, 2023)
- Author, Tensile Trading: The 10 Essential Stages of Stock Market Mastery (Wiley, 2016)
- Co-Founder, StockMarketMastery.com
- Twitter: @GraysonRoze