 Willie Sutton, the notorious bank robber from the 1920s and 30s, was asked once by a reporter why he robbed banks. He famously replied, "Because that's where the money is." Similarly in my seminars, blogs and books, I've preached for years that achieving consistent profitability requires discipline and routines above all else. The ultimate collection of tested, transparent and proven routines is your ChartPack because "That's where the money is!" It's literally a fortress for your money and your routines.
The ChartPack is your real-time dashboard to the stock market, your portfolio and your individual investments. There are almost NO questions you could ask about today's stock markets that could not be answered with the information in these ChartLists. Yes, it's a strong statement.
The fact is that many of the thousands of investors in the Tensile Trading ChartPack user community have contributed their improvements and enhancements over the past decade — thereby upgrading all 99 ChartLists with powerful refinements. For example, don't overlook the helpful educational notes beneath many of the charts. It's a virtual PhD in investing!
An investing truth that I read 30 years ago and carried with me ever since is this: "The main thing that prevents investors from becoming a better version of themselves is themselves." Please dwell on this for awhile.
Onward...here are some of this quarter's updates and improvements:
#105: ETFs Master List
This ChartList of the 178 highest trading volume ETFs provides insights on every level of the market — whether your questions deal with:
- Long or Short Positions
- Big Caps or Small Caps
- Risk On or Risk Off Strategies
- Growth versus Value
- Investment Themes versus Sectors
This ChartList provides you real-time pictures of the market's pulse, and it literally allows you to do a full "blood analysis". For example, a new ETF just appeared due to President Biden's election. The iShares Global Clean Energy ETF (ICLN) popped up in the big volume screens. Similarly, two ARK ETFs were added, justified by their trading volume (AARK and ARKG). On the flip side, we've purged VIOV, RPG and UGAZ due to sleepy volume.
#205: Single Country Funds
Quarter after quarter, I sermonize about the sizable profits to be had from this ChartList. In the past quarter, 49 country funds outperformed the S&P 500 (SPY). For example, South Korea (EWY) and Taiwan (EWT) were up 39% and 27% respectively, and there were 47 more country ETFs too. Check them out for actionable insights quarter after quarter.
#420-12 to 420-90: Fidelity Sector Funds
Fidelity is one of the biggest gorillas on Wall Street, therefore it pays well to follow their investments. Their 44 Sector Funds are focused and deeply researched, and they provide a sort of "buffet of stock picks" to all its other portfolio managers. Part of your portfolio plate should include items from this buffet. Here are some key insights in taking all 44 Sector Funds together:
- 43% of their assets are in Mid-Cap and Small-Cap stocks.
- Foreign stocks account for 3%, but remember that domestic stocks such as Apple and Microsoft are actually global in coverage.
- Relative to the S&P 500, Fidelity Sector managers have over-allocated to Basic Materials by 300% , to Industrials by 50% and to Utilities by 110%.
- The top six largest stock holdings amongst these 44 funds are: United Health Group (UNH), Alphabet (GOOGL), Apple (AAPL), Verizon (VZ), Union Pacific (UNP) and Amazon (AMZN).
- Six separate Sector Funds all own both Visa (V) and Facebook (FB).
Every quarter, we also dig into each of these funds individually and put together and track the changes to the top 10 holdings of Fidelity's Select Portfolio funds. Following what the "smart money" is buying (or selling!) can yield powerful results when you're able to ride some of the big accumulation campaigns by fund giants like these. When a stock you own has institutional support at the highest level, it can be a very strong tailwind for your position. So, here are a few things we noticed:
- In the Automotive portfolio (GR-420-14), the managers took a BIG position in a popular electric vehicle manufacturer – and it isn't TSLA! Take a look there to see what's under accumulation.
- Financials have found some strength in recent months, so it was interesting to note the Banking portfolio (GR-420-16) adding a substantial position in PNC.
- Another strong sector in recent months has been Industrials, and the Fidelity Industrials portfolio (GR-420-54) was quite active this past quarter. Five of the fund's top 10 holdings changed in Q4, so be sure to dig into that ChartList to see what the Industrials portfolio managers were buying – and selling.
- Semiconductors have been an incredible consistent market leader, so we took a close look at what happened this past quarter in the Fidelity Semiconductors portfolio (GR-420-77). Of particular note was a large new position in AMD.
- One other big addition that caught our eye came in the Technology portfolio (GR-420-80). A big solar energy player was a clear target, "running" up to the very top of this fund's top 10 holdings list.
#450: US Dow Industries
The stock market is segmented into 151 Industries by Dow Jones. Outperformers are always to be found in key industries due to Wall Street's "Law of Groupings". Actionable investments and ideas are clearly percolating to the top of this ChartList. For example, when you sort it by three month performance, 68 of these industries have outperformed the Vanguard Total Market Index (VTI) lead by immense gains in both automobile and oil & gas related industries. This is a ChartList worthy of your attention. You will be nicely rewarded!
#640:Dividend Darlings
This ChartList is built of three elements:
- The top dividend-oriented ETFs.
- The best dividend-oriented mutual funds.
- The 12 dividend yielding stocks most owned by #1 and #2 above.
Some of the regular quarterly questions you should ask of this ChartList are as follows:
- Did any dividend-oriented ETFs outperform the S&) 500 (SPY) over the past three months (as of January 23, 2021)? (Yes! Three did so, including DVY.)
- Did any mutual funds here outperform SPY? (Yes, for example IHGIX).
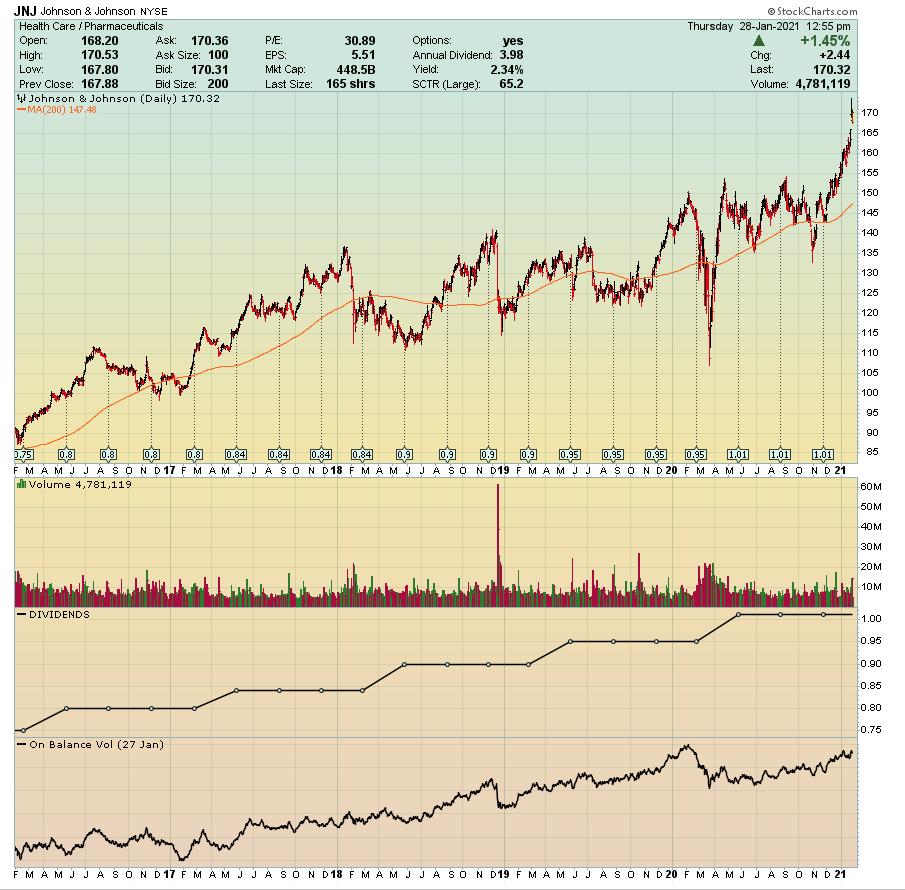
- Which individual dividend-yielding stocks are worthy of your consideration? Johnson & Johnson yields 2.48% and raised its dividend in May. Likewise, Metronic (MDT) yields 1.95% and raised its dividend, as did United Health Group (UNH) to a 1.37% yield.
So you see my point. Pick your performer — be it an ETF, a mutual fund or individual equity. Having said that, if you choose to make this a significant asset class in your portfolio, then you have to take the next step. To assemble a diversified portfolio of dividend yielders, an investor should draw from three arenas in a balanced manner:
- Dividend Ballasts: Stocks which have raised dividends for +20 years in a row. Examples: Johnson & Johnson (JNJ) with 58 years of consecutive increases, and Proctor & Gamble (PG) with 64 years of consecutive increases.
- Dividend Growers: Corporations such as Home Depot (HD) that have aggressively increased dividends for 11 consecutive years.
- High-Yield Dividend Payers: Companies such as Verizon (VZ) that yield over 4%.
Finally, recent studies also point out that dividend yielding stocks have a fine record with respect to inflation — should that ever become an issue again.
BONUS – The ChartPack Is Now ACP Ready!
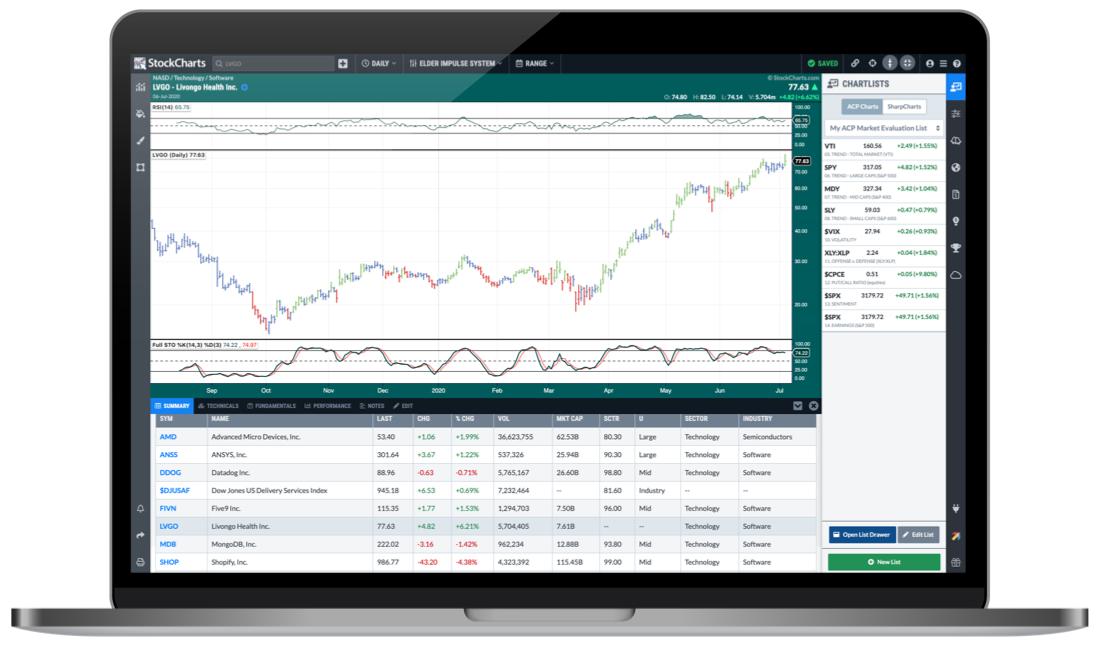 As you've surely heard, StockCharts has recently launched a new interactive, full-screen Advanced Charting Platform - StockChartsACP. This powerful all-in-one charting and analysis package brings you true dynamic charting with the ability to scroll back and forth through time, drag indicators and overlays up, down and around your charts, manipulate the y-axis with your cursor and much more. In short, the future of Technical Analysis and the next generation of StockCharts technology.
Now, one important feature of the new platform is the ability to view ACP versions of your existing saved SharpCharts. You can open the ChartLists sidebar (on the right) and click the "SharpCharts" tab to see your current ChartLists. You can then click on each symbol in the list to see an ACP chart that will very closely match the saved SharpChart. It's a great way to explore the new world of ACP, or quickly get set up with some of your favorite indicators and other chart settings.
What this means for all you ChartPack users is that you can easily explore the ChartPack in ACP, right out of the box. When you install the latest version of our ChartPack, all of the ChartLists and associated SharpCharts will be installed into your StockCharts account. You'll then be able to head over to ACP and browse through dynamic versions of all the charts included in the ChartPack.
Already have the ChartPack? Here's how to upgrade:
- Log in to your account, then visit the "Manage ChartPacks" page (accessible from the bottom of the Members Dashboard or from the "Your Account" page).
- In the table that appears, find the entry for the "Tensile Trading ChartPack" (if you don't see the Tensile Trading ChartPack listed, that means that you haven't purchased it. Click Here to do so now).
- Click the "Re-Install" button next to the Tensile Trading ChartPack to start the update process
The download should take about 10 seconds, after which you can explore the new ChartLists and other updates!
New to the ChartPack? Here's how to install it:
If you'd like to add the Tensile Trading ChartPack to your StockCharts account, Click Here.
Trade well; trade with discipline!
- Gatis Roze, MBA, CMT
- Grayson Roze, VP of Operations, StockCharts.com
Co-Authors, Tensile Trading: The 10 Essential Stages of Stock Market Mastery (Wiley, 2016)
Co-Presenters, How To Master Your Asset Allocation Profile
Trade well; trade with discipline!
Gatis Roze, MBA, CMT
- Author, "Tensile Trading: The 10 Essential Stages of Stock Market Mastery" (Wiley, 2016)
- Developer of the "Stock Market Mastery" ChartPack for StockCharts members
- Presenter of the best-selling "Tensile Trading" DVD seminar
- Presenter of the "How to Master Your Asset Allocation Profile DVD" seminar
Chart on, my friends.
Grayson Roze
- Director of Operations, StockCharts.com
- Author, Trading For Dummies (Wiley, 2023)
- Author, Tensile Trading: The 10 Essential Stages of Stock Market Mastery (Wiley, 2016)
- Co-Founder, StockMarketMastery.com
- Twitter: @GraysonRoze