 This is an update to an important blog I wrote three years ago. Investors have once again been misled by the media and bamboozled by ETF sponsors such as iShares, SPDRs and Invesco. Exchange traded funds (ETFs) are not the panacea for every asset class as they all want you to believe they are.
In my own portfolio, approximately 40% of my asset classes are covered by ETFs, but another 40% are no-load mutual funds and each is "Best of Their Breed." Individual stocks account for about 20%. My objective with this blog is to shatter the myth that ETFs should replace all your mutual funds and stocks. I'll show you that achieving outperformance is best done by blending a mix of both passive ETFs and active mutual funds depending on your asset class!!
Upfront, I need you to embrace the fact that the biggest determination of your profitability as an investor is not which stock, ETF or mutual fund you select but how you allocate your assets amongst your different asset classes. Having said that, the first two steps are about being in the right asset classes and then optimizing the dollar allocations within each asset class. Having taken care of that business, you are free to move on.
I'll use my asset class of U.S. Mid-Cap Growth Stocks as my first example. I search out the best mid-cap ETFs using Morningstar and ETF.com. I do the same with mid-cap growth mutual funds. This produces a small universe of mid-cap possibilities upon which I can now perform in-depth comparisons. Your brokerage house websites will have useful comparison tools for this which will highlight costs and performance data which I do utilize. However, I have found that over time I first gravitate to using the lens of a visual investor.
Stockcharts.com to the rescue! The PerfChart in the hands of a knowledgeable investor is indeed a profit generating tool. In fact, similar to ChartList #10.07 (59 asset classes from our book and in our ChartPack), I personally maintain a ChartList with 20 charts, each representing one of the 20 asset classes across which I have diversified my own portfolio. For most investors, you don't need 20 asset classes.
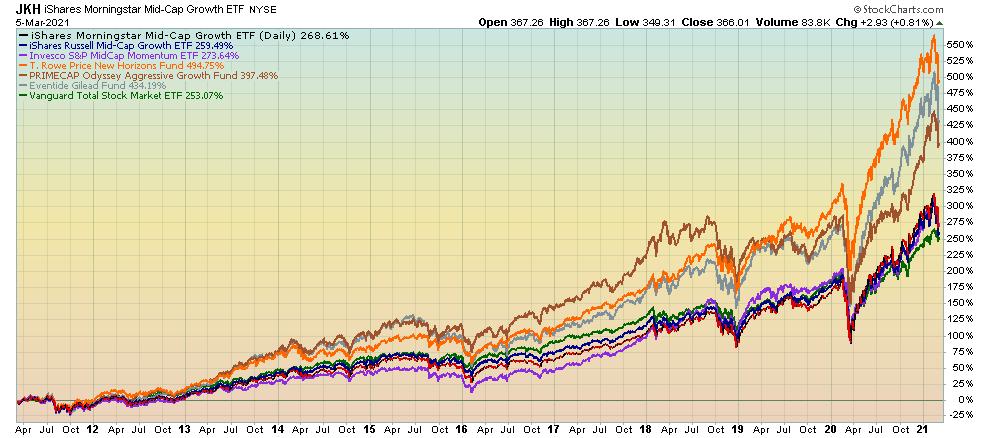
The following chart is from my personal ChartList. I maintain this mid-cap chart and update it as better ETFs or mutual funds might appear. You'll see that the mid-cap growth ETF (JKH) is my preference for best growth ETF. I considered IWP, and XMMO, but my pick was JKH. For mutual funds, you see that I have plotted PRNHX, ETILX and POAGX. I also always plot Vanguard Total Market (VTI) in green to constantly monitor the specific asset class versus the market. It's a habit I suggest for you all. In addition, I use the representative ETF for each asset class chart as my heading. This ticker always prints as a black line by default and for visual consistency. Don't ignore the visual consistency aspect of this.
So the benefits of maintaining these 20 charts of my asset classes are as follows:
- My personal investment allocation to USA Mid-Cap Growth Stocks is achieved through JKH, PRNHX and POAGX and is constantly monitored in relation to its peers and the market (VTI).
- Since both PRNHX and POAGX clearly outperform the best ETF, they justify their higher management fees .
- They also clearly outperform the market (VTI).
- When new options present themselves for consideration, such as ETILX, I plot them on this chart and can quickly ascertain if they are candidates worthy of my investment dollars.
- Monitoring extraordinary closed mutual funds also allows you to pounce on an opportunity if and when they reopen a closed fund.
This first example clearly proves that paying PRNHX higher fees than an ETF (JKH) is justified due to their consistent outperformance. I welcome your alternatives if you disagree!
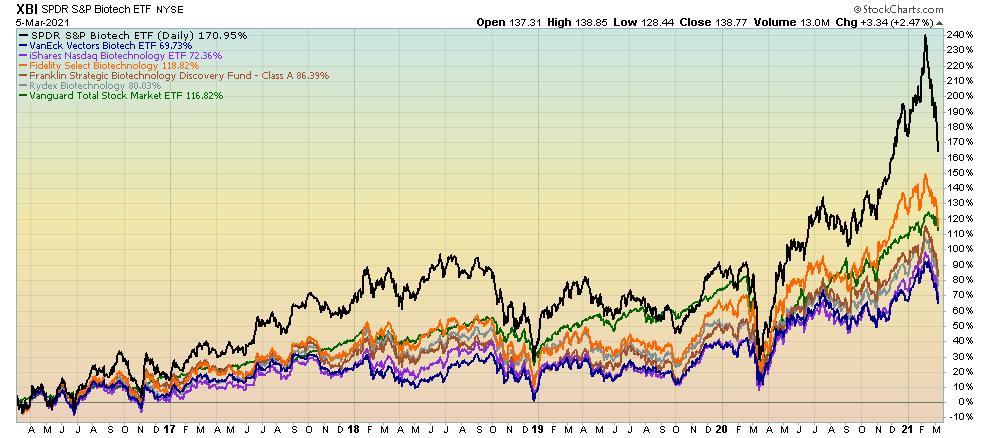
My second example will be cheered by the ETF crowd. Biotech is an asset class that I deem as a long-term hold. From the chart, you can see that XBI is outperforming its sister ETFs (PTH and BBH), as well as three top mutual funds (FBIOX, FBDIX and RYOIX).
I choose XBI as my Biotech investment vehicle, not simply based upon its outperformance but also because of the following:
• low expenses (0.35%)
• large asset base leading to small trading spreads — $8 Billion
• broad basket of 170 holdings
• mid-cap to small cap company focus
In this asset class, the mutual fund managers have not proven to me that they can justify their higher fees with long term outperformance. Therefore, the winner is an ETF in the Biotech asset class.
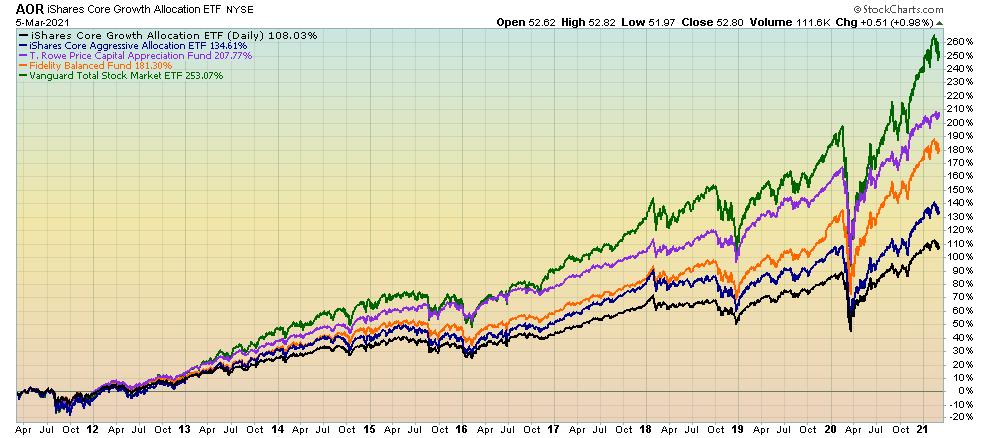
The third example is the moderate allocation asset class (or Balanced Funds) which means funds that maintain a mix of bonds and 50-70% equities. This example is an investing testimonial on three fronts:
• for long term investing
• for asset allocation executed by competent money managers
• for active mutual funds over passive ETFs
In this asset class, there are a good number of active managers to choose from who add value over the passive ETF alternatives and can justify their fees. My vehicle of choice for this asset class is the T. Rowe Price Capital Appreciation Fund which I've owned for a very long time.
The key takeaways from this blog as I see it are these five points:
- Your asset allocation decisions are high leverage and really matter big time! To do it like a pro, watch the top-selling DVD seminar that Grayson and I recorded on just this topic.
- Passive ETF investing might be the rage, but it's only best for you roughly 50% of the time.
- Maintaining a ChartList of your different asset classes that plot the best ETFs and mutual fund options will yield outperformance and minimize your fees. It's one of the rare instances where "you'll get what you don't pay for", as John Bogle used to say.
- When you are presented with a new investment candidate in a specific asset class, you can easily compare it to your existing best-of-breed charts and either embrace it or jettison it.
- Plotting VTI on each asset class chart challenges you to consistently compare your asset class and investment vehicle to the total U.S.A. market. Does it justify your investment or has it earned more investment from your portfolio?
So now you know! You will no longer be deceived or be duped by the media into believing ETFs are the only way to invest. They have their place, but so do no-load mutual funds.
Trade well; trade with discipline!
- Gatis Roze, MBA, CMT
- Author, "Tensile Trading: The 10 Essential Stages of Stock Market Mastery" (Wiley, 2016)
- Presenter of the best-selling "Tensile Trading" DVD seminar
- Presenter of the "How to Master Your Asset Allocation Profile DVD" seminar
- Developer of the Tensile Trading ChartPack for StockCharts members
Trade well; trade with discipline!
Gatis Roze, MBA, CMT
- Author, "Tensile Trading: The 10 Essential Stages of Stock Market Mastery" (Wiley, 2016)
- Developer of the "Stock Market Mastery" ChartPack for StockCharts members
- Presenter of the best-selling "Tensile Trading" DVD seminar
- Presenter of the "How to Master Your Asset Allocation Profile DVD" seminar


