Picking the right stock is a lot like catching that perfect wave. You're out there in a sea of possibilities, looking for that perfect setup. Is the stock coming out of a powerful base and ready to crest? And is there enough room for your stock to run? Not every wave is going to take you for a long ride, so knowing when to bail will make all the difference for your success.
This is particularly true in the markets where staying with an underperforming stock can put you underwater quickly. You'll want to have a system in place to alert you to when the uptrend has ended and it's time to bail.
DAILY CHART OF STARBUCKS (SBUX)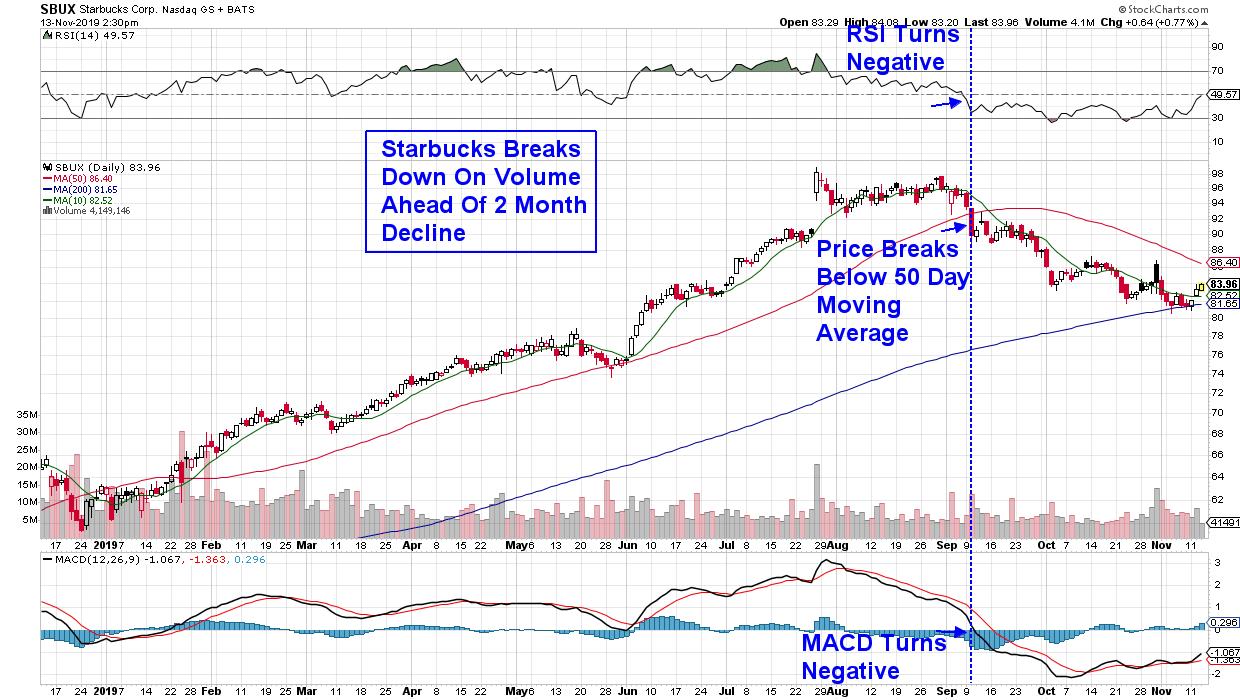
Above is a prime example of a winning stock during the first half of the year that went on to fall out of favor. Starbucks (SBUX) held remarkably well during a difficult August period, only to then come under heavy distribution in early September. As you can see in the marked-up chart above, the first major negative signal was a break of the stock's price below its key 50-day moving average on volume.
This occurred in conjunction with 2 other key negative signals, as the RSI (shown above the chart) broke below 50 while the MACD (below the chart) crossed below zero. When these 3 events occur simultaneously, you're well served by exiting your stock.
DAILY CHART OF MCDONALDS CORP. (MCD)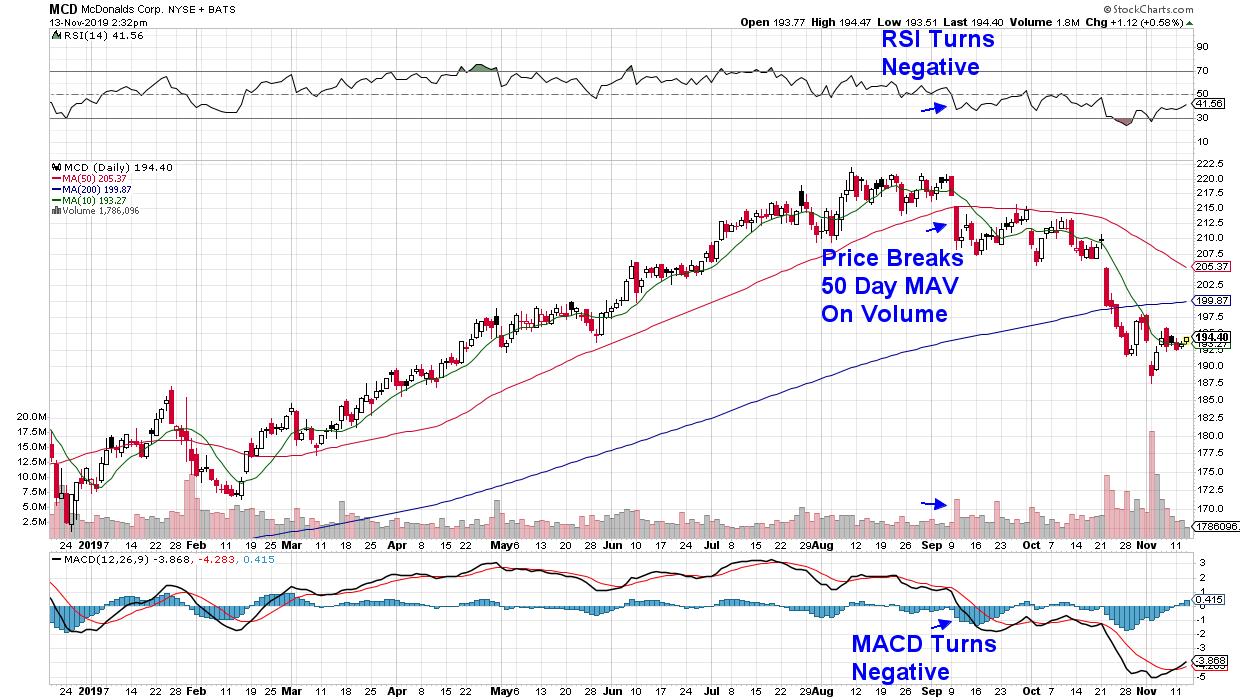
Another top performer in this group was McDonalds (MCD), which was up 26% for the year before coming under selling pressure in early September. The stock had a big one day drop on Sept 9th; while the company did announce the purchase of a tech company, the news was not worthy of the sharp selloff.
As you can see, similarly negative dynamics that occurred in Starbucks (SBUX) took place in MCD, with the RSI and MACD turning negative at the same time as the stock's price broke below its 50-day moving average.
DAILY CHART OF DOW JONES RESTAURANTS & BARS INDEX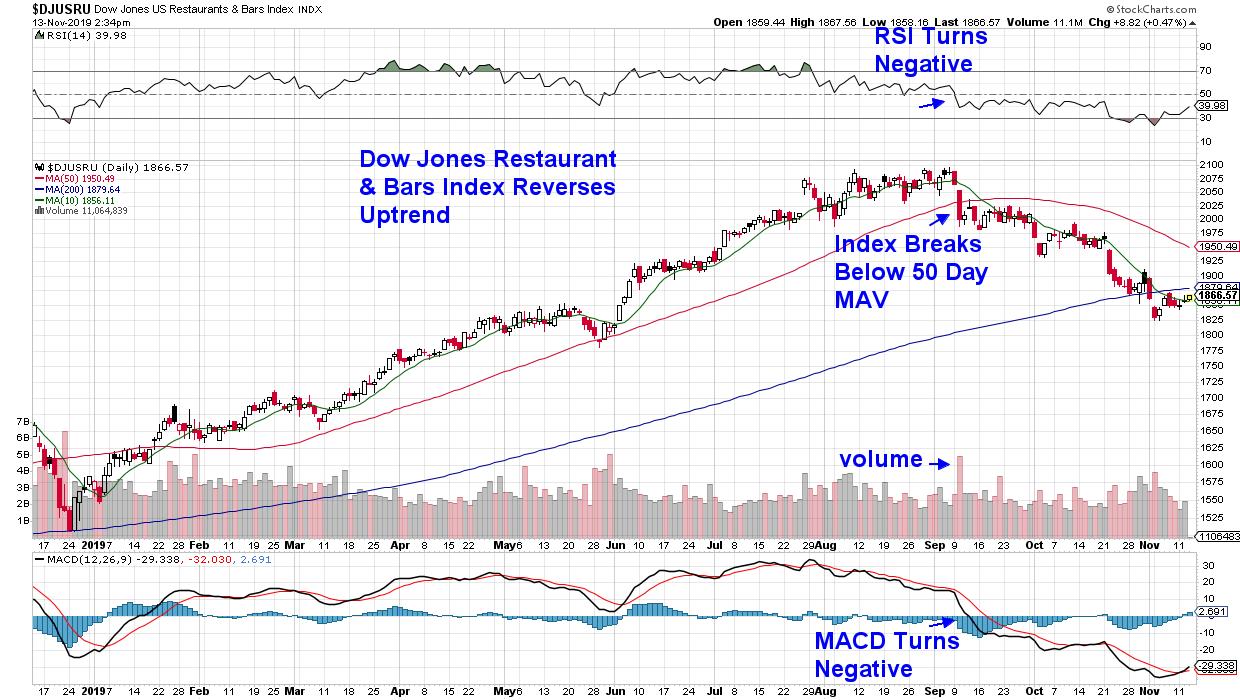
Another important way to gauge if your stock may be headed for more downside is to pay attention to the chart of the group that the stock is a part of. Group affiliation has been shown to have a huge impact on the action in your stock. As you can see, the Restaurant and Bar Index turned negative at the same time.
Another chart from this group you can take a look at is Wingstop (WING). This was the biggest winner from the Restaurant group, and my MEM Edge Report had it on our Suggested Holdings List until its break at the beginning of September when we removed it.
This ability to know when your stock's run is over will help keep you afloat, as will your ability to catch a stock just as it's cresting and ready to ride higher. For those who'd like to be alerted to groups coming into favor and the key stocks poised to take advantage, take a look at my MEM Edge Report. This bi-weekly research provides insights you won't see elsewhere. You can take a 4-week trial at a nominal cost using this link here.
Warmly,
Mary Ellen McGonagle,