Shares of Nvidia (NVDA) soared today after the company reported earnings that were well above estimates. Most impressive, however, was the company's estimates for next quarter's revenues, which were more than 50% above what Wall Street projected. NVDA cited surging demand for its chips that help with artificial intelligence applications, and the stock is poised to trade higher. Subscribers to my MEM Edge Report will be familiar with NVDA as we added the stock to our Suggested Holdings List last January, where we've since provided buy signal alerts.
In addition to Nvidia, those wanting to participate in the AI-driven growth trend can look to companies that provide products to the company, which is a leader in AI. Taiwan Semiconductor (TSM) is one such company. As the most advanced chipmaker in the world, they manufacture the chips used by NVDA, and TSM gets a cut of whatever Nvidia makes.
Daily Chart of Taiwan Semiconductor (TSM)
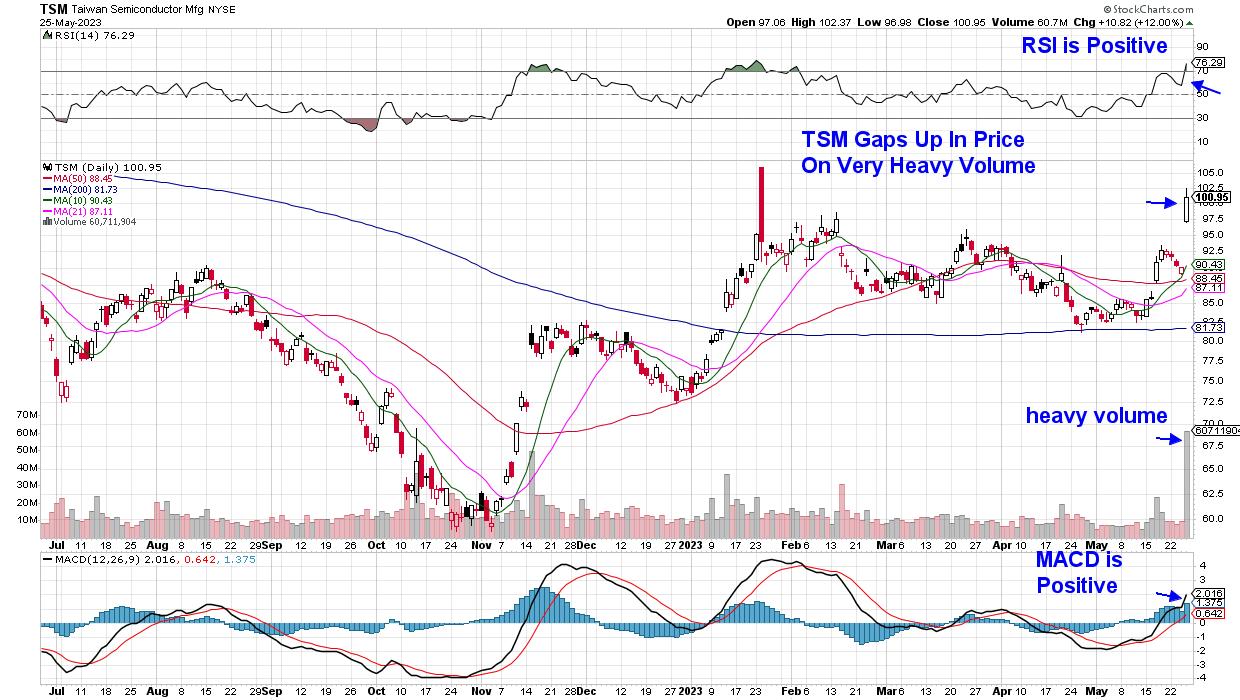
Taiwan Semiconductor (TSM) gapped up 12% on very heavy volume today. The high volume indicates that the stock is being accumulated and this often points to further upside.
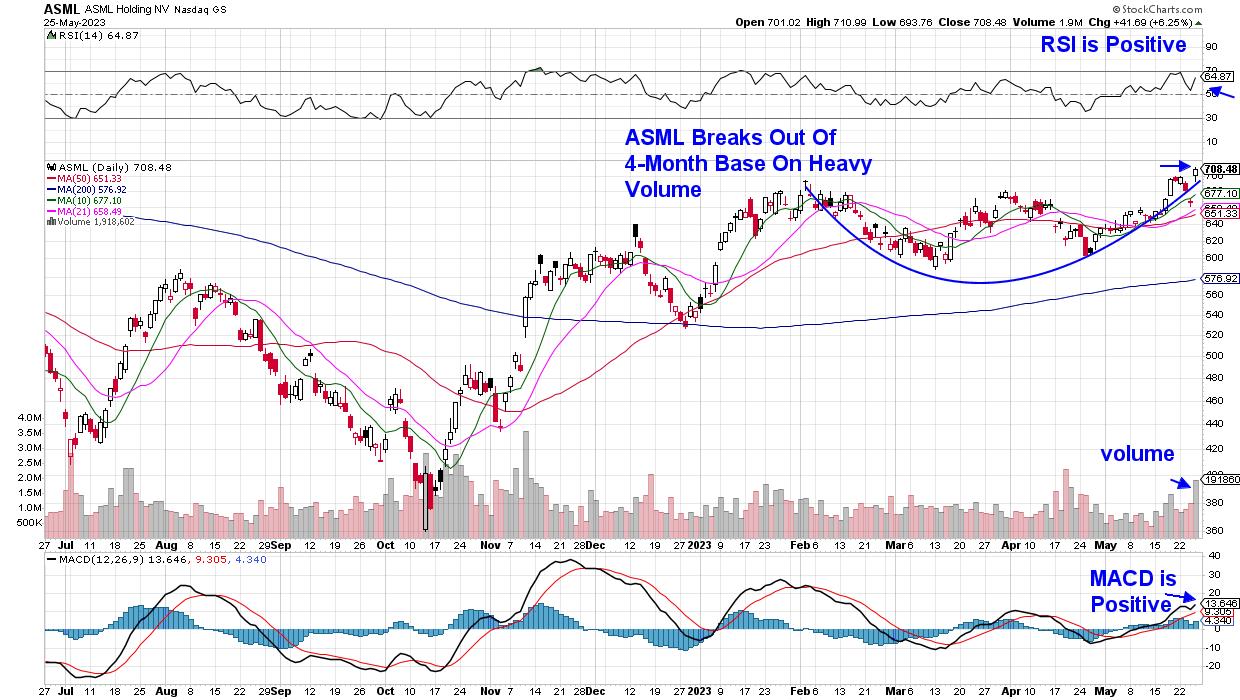
Netherlands-based semiconductor equipment manufacturer ASML (ASML) is the only company in the world that can make its extreme ultraviolet (EUV) lithography machine. This tool is required by companies such as TSM and other chipmakers in the AI space. ASML broke out of a four-month base on heavy volume today. Base breakouts often precede lengthier uptrends, and the longer the base, the longer the advance out of that base.
Daily Chart of ASML Holding (ASML)
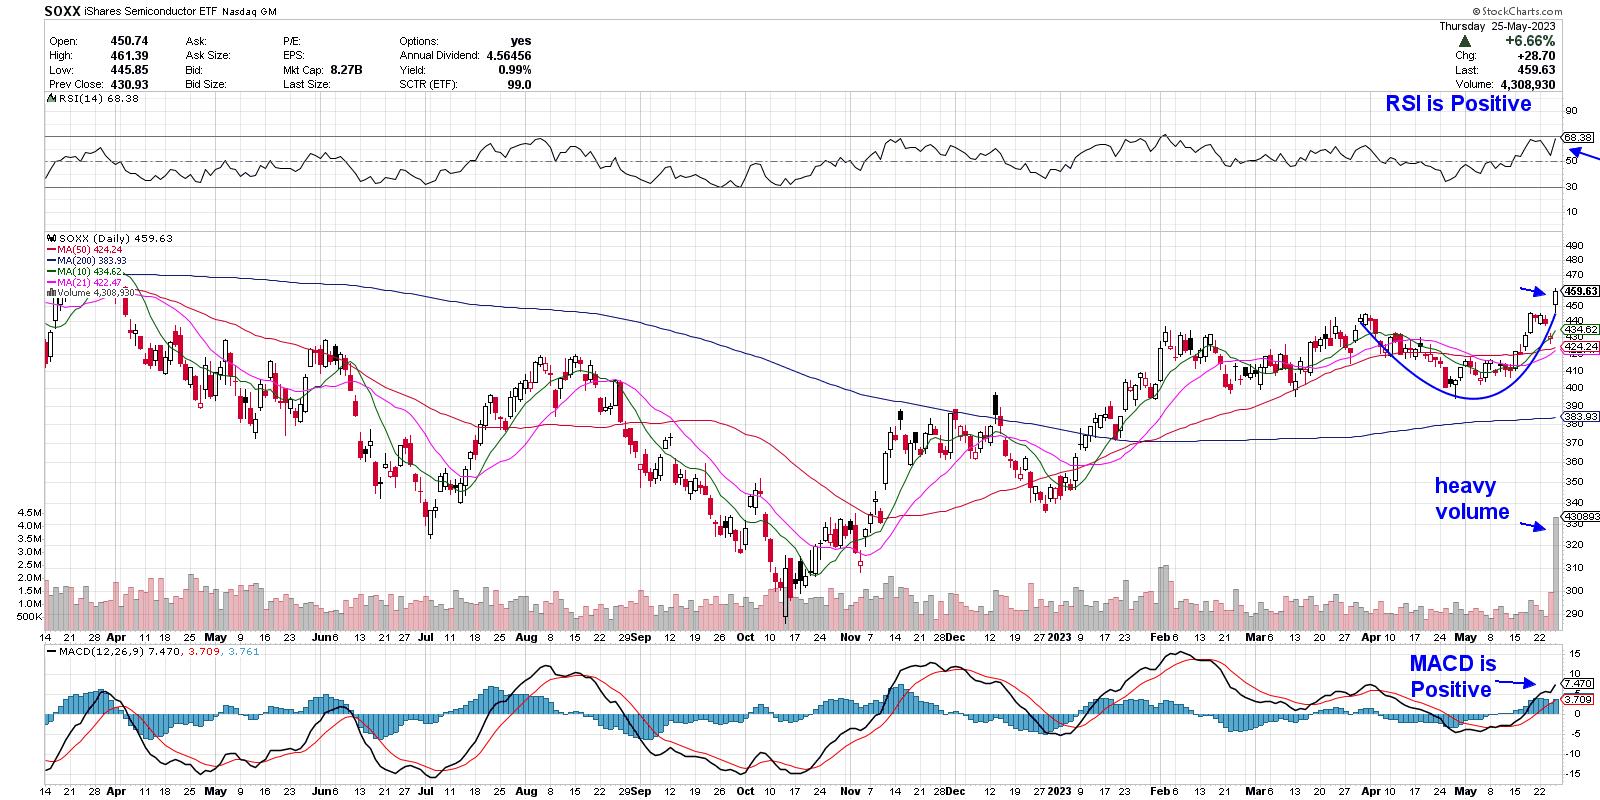
Given that each of these companies is in the semiconductor industry, you'll want to keep an eye on a semiconductor ETF such as SOXX. In the chart below, you'll see positive momentum in the group with a positive relative strength index (RSI) and Moving Average Convergence Divergence (MACD). Semiconductor stocks are highly cyclical and can pull back amid hints of an economic slowdown. A break below the 50-day moving average and a negative RSI or MACD would indicate a reversal of the current uptrend.
Daily Chart of iShares Semiconductor ETF (SOXX)
Warmly,
Mary Ellen McGonagle, MEM Investment Research
*This article was published earlier today at SimplerTrading.com