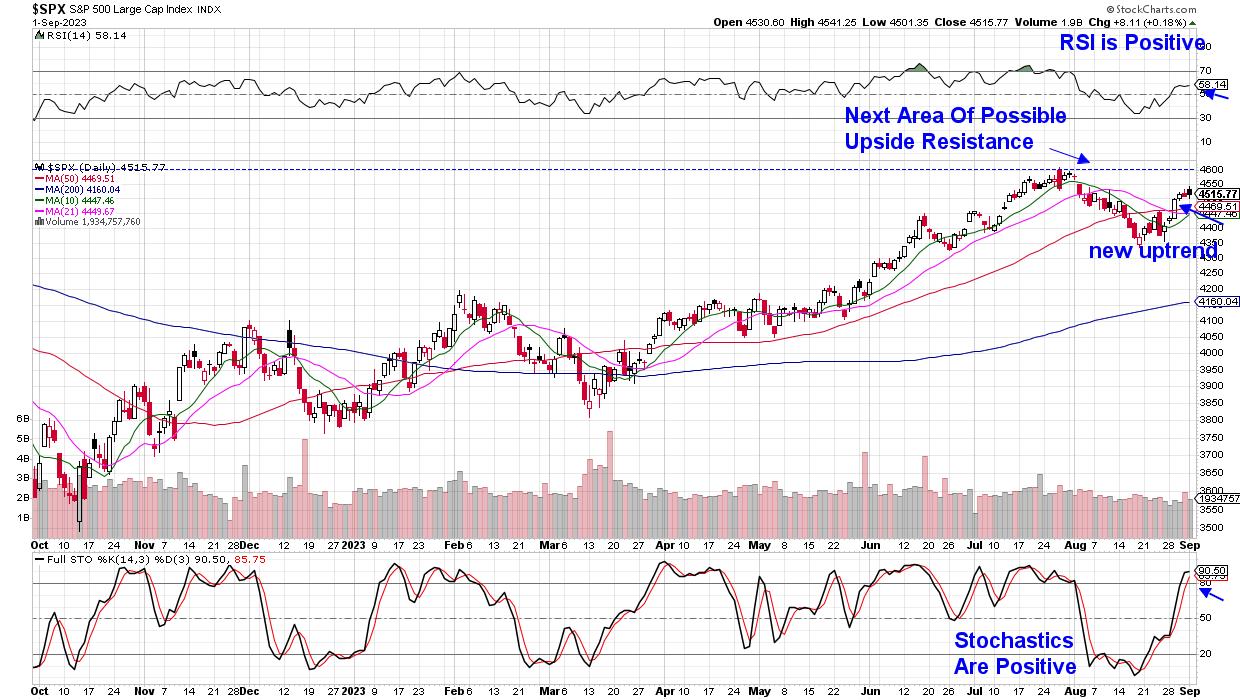
Last week, the broader markets regained their uptrend, with the S&P 500 and Nasdaq Indexes both closing above their key 50-day moving averages on Tuesday. In addition, the RSI and Stochastics turned positive as well. This price action indicates that the 3-week pullback which began in late July has been reversed.
The biggest winners last week were growth stocks, which had tumbled the most amid a rising interest rate environment that began in late July. Rising rates are negative for growth stocks, as they reduce the value of future earnings.
DAILY CHART OF S&P 500 INDEX
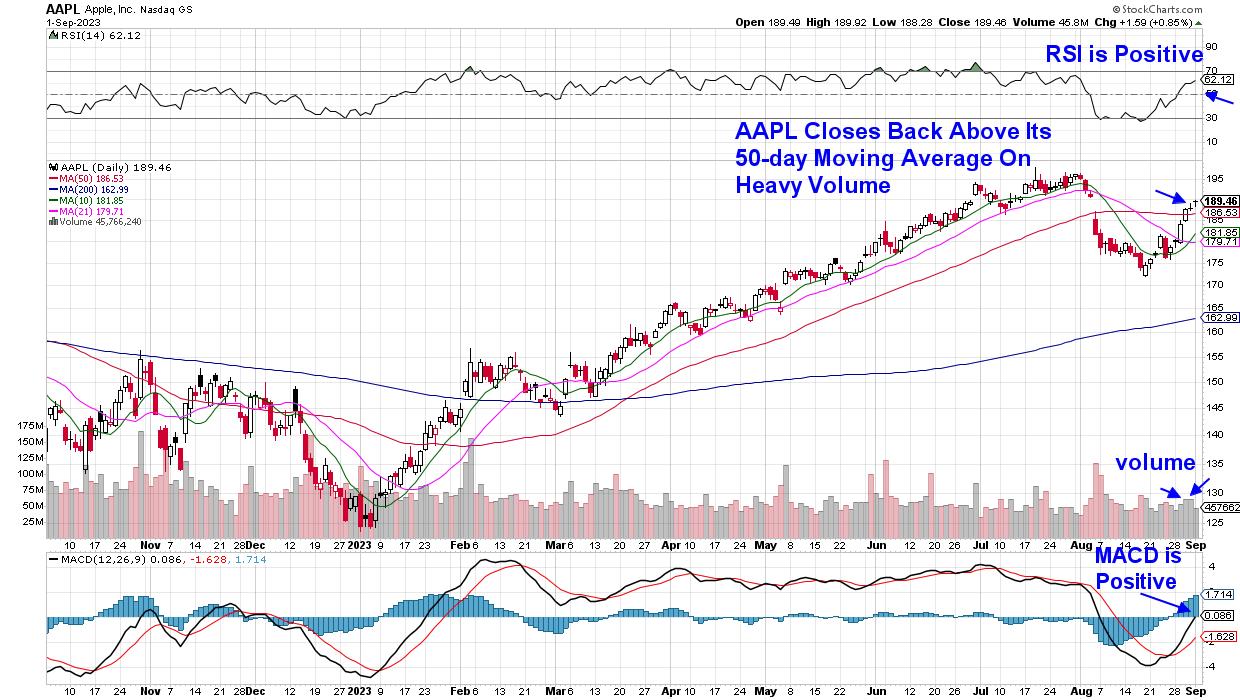
Rates pushed lower last week as investors regained optimism that the Federal Reserve will continue to pause their rate hike campaign. The shift occurred due to weaker-than-expected economic and inflation data. Technology stocks were the biggest winners, with recently weak Semiconductor and Software stocks rallying an average of 5% last week. A rally in heavyweight stock Apple (AAPL) also gave the Indices a boost. Last week's rally in AAPL occurred amid investors' optimism surrounding the company's iPhone 15 release, which is expected on the 12th of this month. While the chart is in a bullish position from which to trade higher, September tends to be a poor month for Apple, with shares falling more than half of the time following a bullish run up into their product releases.
DAILY CHART OF APPLE (AAPL)
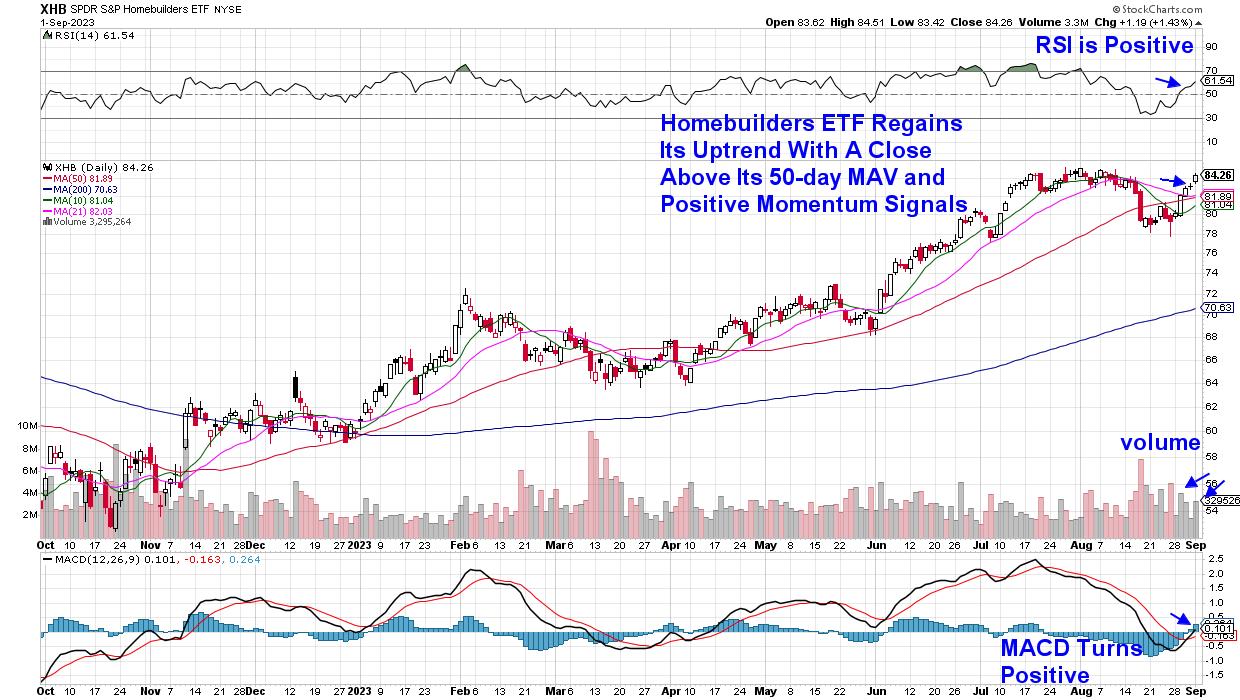
A better option might be to take advantage of the move back into Homebuilding stocks, which regained their uptrend after declining rates pushed mortgages lower. Sales of new U.S. single-family homes rose in July, as an acute shortage of existing homes drove buyers to new units. This shortage of properties offset the impact of high mortgage rates in July that had dampened demand in prior months. Below is a chart of the S&P Homebuilders ETF (XHB), which points to further near-term upside for this group.
DAILY CHART OF S&P HOMEBUILDERS ETF (XHB)
Last week's impactful economic data provided plenty of fuel for the markets, as weak reports were viewed as a positive amid receding fears of further rate hikes. Next week, the economic calendar is very light, which may leave room for a reinterpretation of the Fed's possible action at their next meeting later this month. In the chart of the S&P 500 above, we've highlighted key areas of near-term support and resistance.
For those who'd like to be kept up to date on market sentiment as well as be alerted to new stock candidates as they're added to my twice-weekly MEM Edge Report, use this link here to receive immediate access to recent reports, as well as this Monday's new report. Subscribers were alerted to the market's new uptrend on Tuesday, where we added two new stocks to the Suggested Holdings List. These high-quality growth stocks were in the Software and Semiconductor groups, which have also just recently regained their uptrend.
Enjoy the long weekend!
Mary Ellen McGonagle, MEM Investment Research