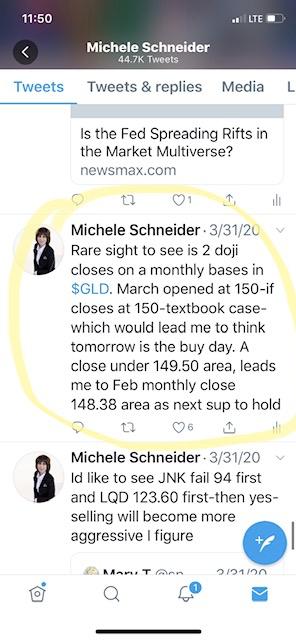
On March 31st, I tweeted about the gold ETF (GLD). Let me just say, it is a good thing I do not rate my trading advice on the number of likes I get.
So, with the tweet spot on, the very next day, me and my MMM Advantage members entered long at 149.50. Since we had taken profits, we added to the position and took profits again. To date, we still hold a core position.
With the huge earnings week, central bank bond buying, burgeoning money supply and a market that has rallied off the lows way more than most expected, it is time to look at the metal again.
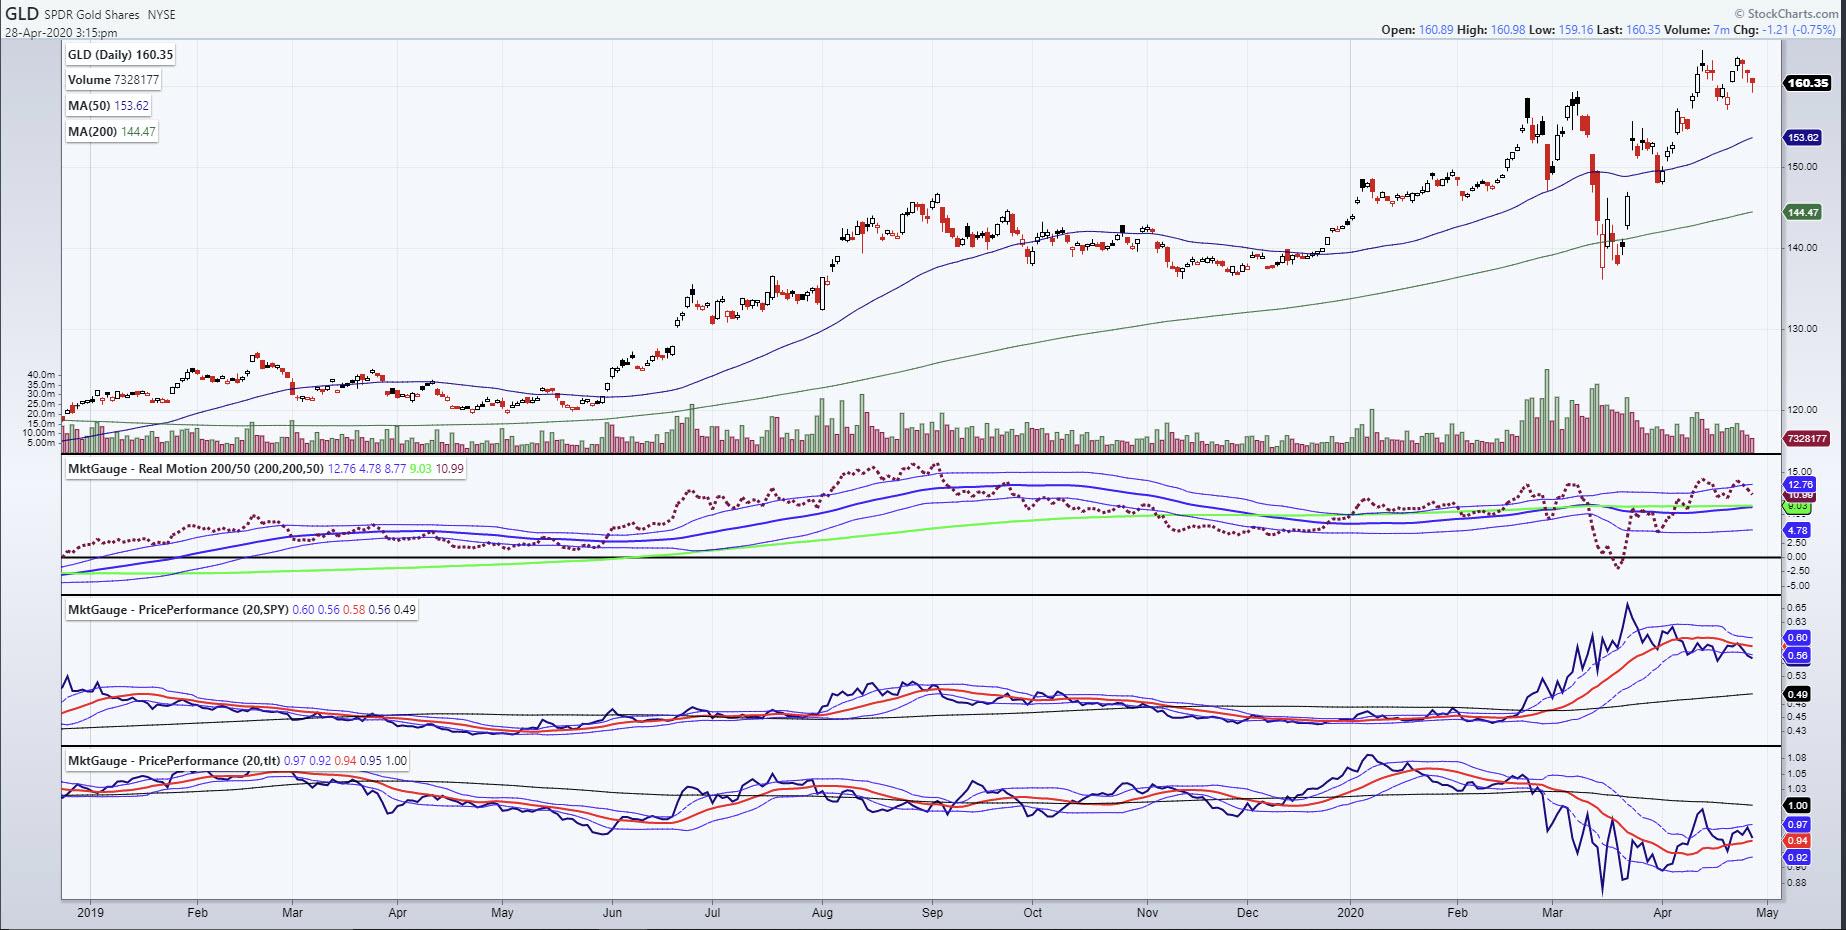
Here is a StockCharts chart with our proprietary indicators, RealMotion and Triple Play Indicators. As far as pure price, the phase is bullish. Even though the price has come off the highs, it's still in relatively good shape. Furthermore, the average daily volume has steadily declined during the correction.
The Real Motion Indicator shows that when GLD made a new high close on April 13th, the momentum was very strong. Then, on the next high close on April 23rd, note that the momentum did not make a new high, thus showing a divergence between price and momentum.
Currently, should GLD's RM indicator break down below the last swing low, then it could be that GLD is ready to correct harder. If, however, the momentum holds here and starts to go back up, that is most likely telling us that GLD's bullish phase is still intact.
Price performance, or GLD relative to SPY, shows that GLD is underperforming on a monthly basis. Against the bonds, though, GLD is still outperfoming on a monthly basis, but not on a 6-month basis.
Conclusion - We will know very soon if momentum picks up or fails further and, consequently, whether we add to our position or keep our trailing stop and exit should it get hit.
- S&P 500 (SPY): Watch for a hold of 285, then 281. Failed at the exact resistance in the weekly charts
- Russell 2000 (IWM): 127 the 50-DMA support to hold if good. 134.50 resistance
- Dow (DIA): 237 support to hold
- Nasdaq (QQQ): 210 should hold if good
- KRE (Regional Banks): Failed to get through the 50-DMA
- SMH (Semiconductors): Messy day - nearest support is at 130.00
- IYT (Transportation): Could not close over the 50-DMA. 145 support
- IBB (Biotechnology): Nasty looking candle close, but support at 123.50 should hold if good
- XRT (Retail): 38.50 is huge resistance with 35.00 support
- Volatility Index (VXX): Managed to close just over the 50-DMA. See what happens at 40.00
- Junk Bonds (JNK): 96 support to hold, 98.35 resistance
- LQD (iShs iBoxx High-Yield Bonds): Inside day. Over 130 better
Mish Schneider
MarketGauge.com
Director of Trading Research and Education
