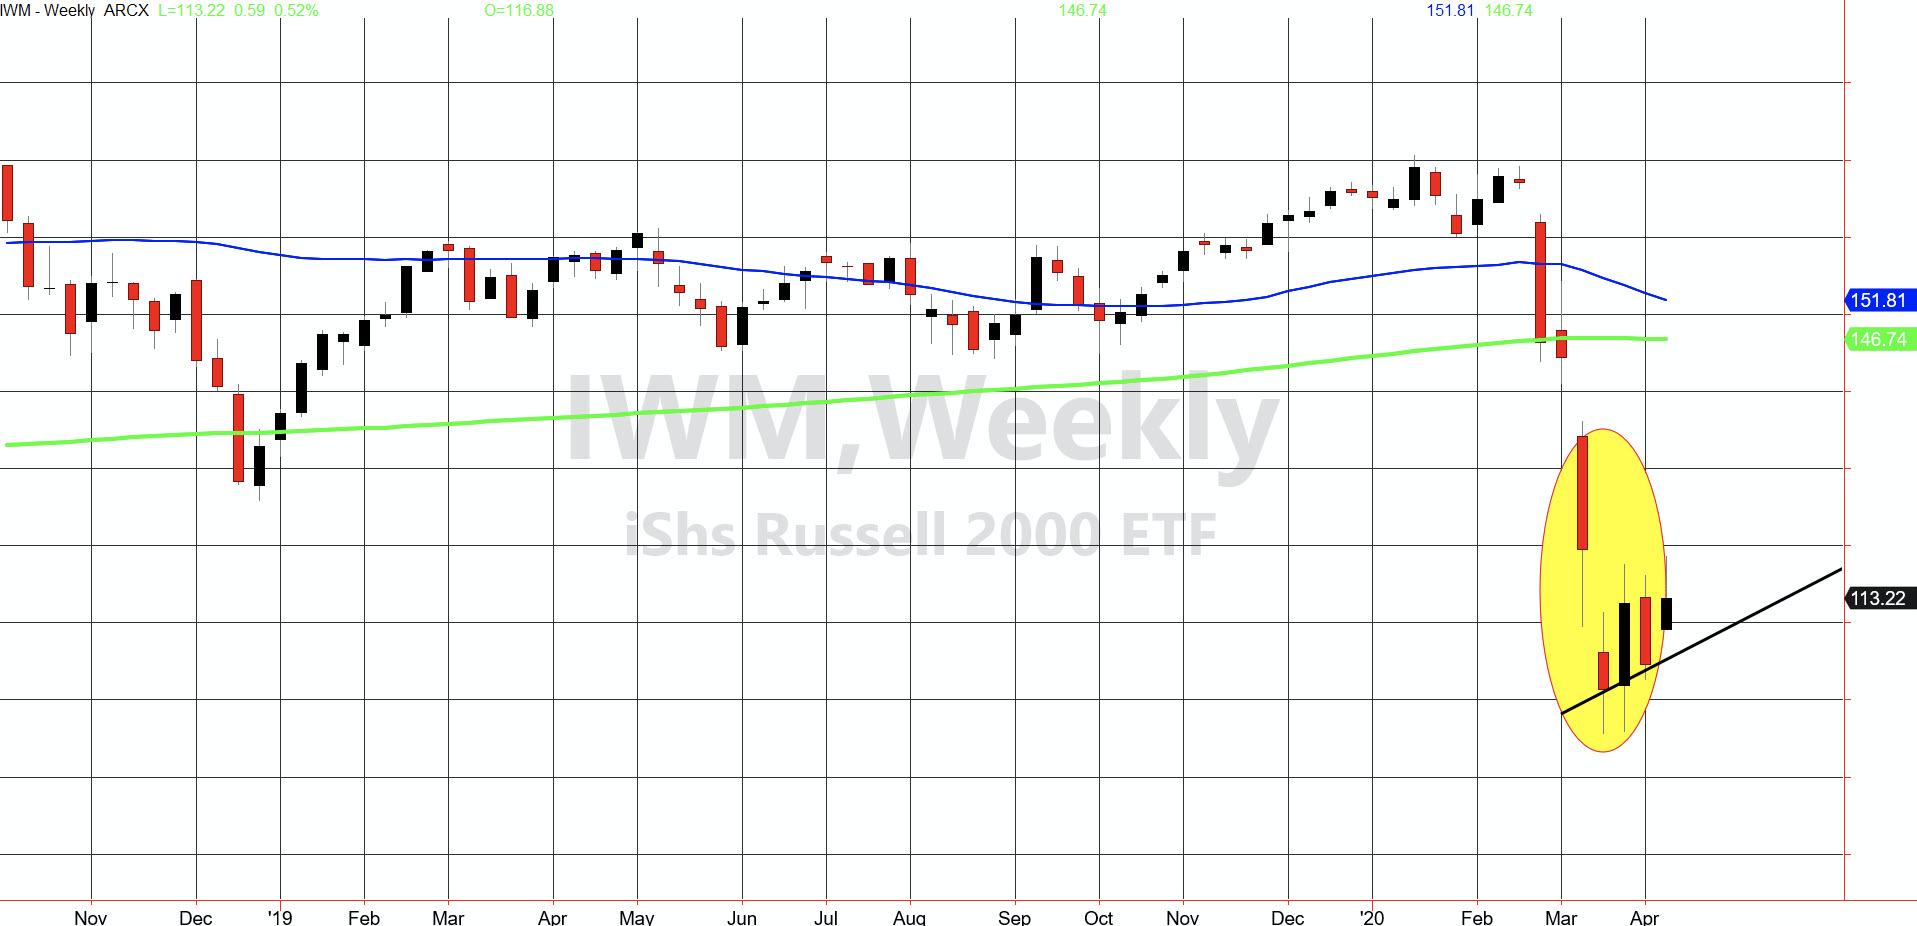
The Russell 2000 (IWM) weekly chart has helped us navigate the bull and bear runs for years.
While you hear so much about a V-Bottom, I see no evidence of it in this index. Significant?
Also, considering it came in having to clear the outside week trading range or move over 117.60, it did so early on and wound up closing at 112.95. Take that as a sign of weakness or a sign of a healthy pullback - that is up to you.
Regardless of where you stand, look at the potential setup on the weekly chart and ask yourself - do I want to go counter, or trade in the direction of the overall trend?
In the spirit of objectivity, we can look at the weekly chart of IWM as either a bear flag forming or a consolidation before another rally.
Case 1: A bear flag forming
The black trendline links the closing levels of the last 3 weeks. With candlestick charts, that is easy to see. Where the body of the candle ends is the weekly closing price.
Should IWM close under 104.50-105.00 this week, that is a break of the bear flag. The flagpole within the ellipse shows a measured move of $45 down if that level breaks. That sounds scary.
Case 2: Consolidation before a breakout
IWM needs a weekly close over 116.00-117.60, which would negate the bear flag. In that case, IWM could rally to around 135 before we reassess.
As of today, the instrument trades in the middle of the worst- and best-case scenarios. That makes it lukewarm in a bear trend.
- S&P 500 (SPY): 258 support, 264.49 pivotal; today might have been the top
- Russell 2000 (IWM): 112.56 pivotal, 105 support and 108 resistance
- Dow (DIA): 236.80 huge resistance and 218.60 support
- Nasdaq (QQQ): Got to 200, which I wrote was a short. So, we shall see - over 202, probably not, whereas under 188, yeah
- KRE (Regional Banks): 35.00 resistance, 32 support
- SMH (Semiconductors): If we take 127 as a short, should not clear 130. Under 117 not very good-looking
- IYT (Transportation): 145 resistance, 137.45 support
- IBB (Biotechnology): Teetering on support at 109
- XRT (Retail): 30.00 pivotal
Mish Schneider
MarketGauge.com
Director of Trading Research and Education


