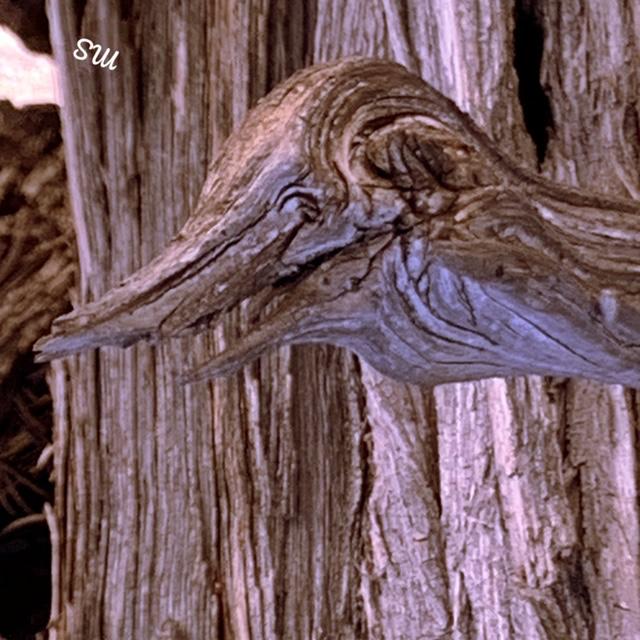
I love this photo. If you see it right side up, it looks like a piece of deadwood coming out of the tree trunk. Upside down, it looks like the head of a bird.
(Okay, maybe a somewhat prehistoric bird, but a bird nonetheless.)
The point is it reminds me of the market this past week. If the market were truly reflecting the times - civil unrest, potential for a second wave of the pandemic, an unemployment rate of more like 16% (considering the millions who were counted as employed receiving PPP money) - then it would look like a piece of dead wood.
Instead, the market is like what I did to this photo, i.e. moved upside down to show you the illusion of a perfectly wood-sculpted bird. I even put my initials upside down to reinforce that point.
This got me thinking - with NASDAQ making new all-time highs along with Semiconductors, is this really an illusion or a photographer's trick?
Last week, I featured the volatility index (VXX). On Friday, it closed lower, but not that far from its 200-DMA. Bonds (TLTs), which had a huge selloff, reversed and closed on the intraday highs. And Gold miners (GDX) tested its 50-DMA and closed well above it. Bonds and miners, in particular, have my attention for this week.
Hence, what does a market top look like?
- A huge rally to new highs, with big volume, can be a blow off top. Semiconductors (SMH) is a prime example. SMH made a new high at 154.77 and closed near the intraday lows. Should it close Monday under 152.15, then that could yield a 10% correction. These blow offs, followed by a reversal, is one way to determine a top.
- A blow off top with huge volume does not have to show up in a one-day pattern. Let's look at QQQ, which closed on new all-time highs. Now, it could gap higher and hold - or it could fail. Or it could open lower and have an inside day. Or it could open lower, sell off and close under Friday's low. In every scenario, we look for a topping pattern to emerge at some point soon.
- An exhaustion gap has many parameters. The one I am interested in is the one that could be setting up in Regional Banks (KRE). That gapped up, failed to clear the 200-DMA, then closed near the intraday lows. I like KRE for the last couple of years as an early indicator of impending weakness in the market all around. KRE has to close under 44.22 Friday's low.
- Other ways to find tops are island tops, plus double and triple tops. I do not see any in this market currently.
Going back to VXX, TLT and GDX - these are all counter movers that had huge corrections and potentially reversed on Friday.
One other instrument to note is Transportation (IYT). Like KRE, IYT has often proved reliable as an early warning indicator. On Friday, IYT cleared, then reversed to close below the 200-DMA.
Come Monday, I will be watching carefully to determine if the market maintains its bird-like illusion - or if turns right-side up and becomes deadwood.
Keith took a turn at my StockCharts TV show and gave a 30-minute presentation. Here is the video:
- S&P 500 (SPY): 323 big resistance; a move under 317 suspect
- Russell 2000 (IWM): Needs to hold 147.30 to maintain this rally
- Dow (DIA): 263 big support, resistance at 280.
- Nasdaq (QQQ): Uncharted territory - just like this whole year
- KRE (Regional Banks): 48 resistance and needs to hold
- SMH (Semiconductors): If there is a reversal, this can drop to 140 and still look good. 160 resistance
- IYT (Transportation): 177 resistance. If fails Friday's low, 162.50 next big support
- IBB (Biotechnology): 130-136 current range
- XRT (Retail): Another possible exhaustion gap reversal. 43.50 pivotal
- Volatility Index (VXX): Cash closed right on the 200-DMA
Mish Schneider
MarketGauge.com
Director of Trading Research and Education
