Gold shot up, Bonds (TLT) rallied, oil flew and the economic Modern Family showed its reliability once again.
After the FOMC and the super dovish minutes were released, here is the skinny of the FOMC major points: unlimited stimulus, rates near zero for at least a year and a half, no V-shaped recovery but hope to get jobs rate back to 9.5% by the end of December - and yet, there's fear of a second wave.
But my absolute favorite - inflation rate still below 2%. However, here's what that rate does not include: energy and food.
I'm sorry - this is not exactly haha funny, but anyone who buys gas and eats - oh wait, that's everyone - knows that those costs are going up. Stagflation? I am even more convinced that we will that term more and more in the next six months. Though I digress.
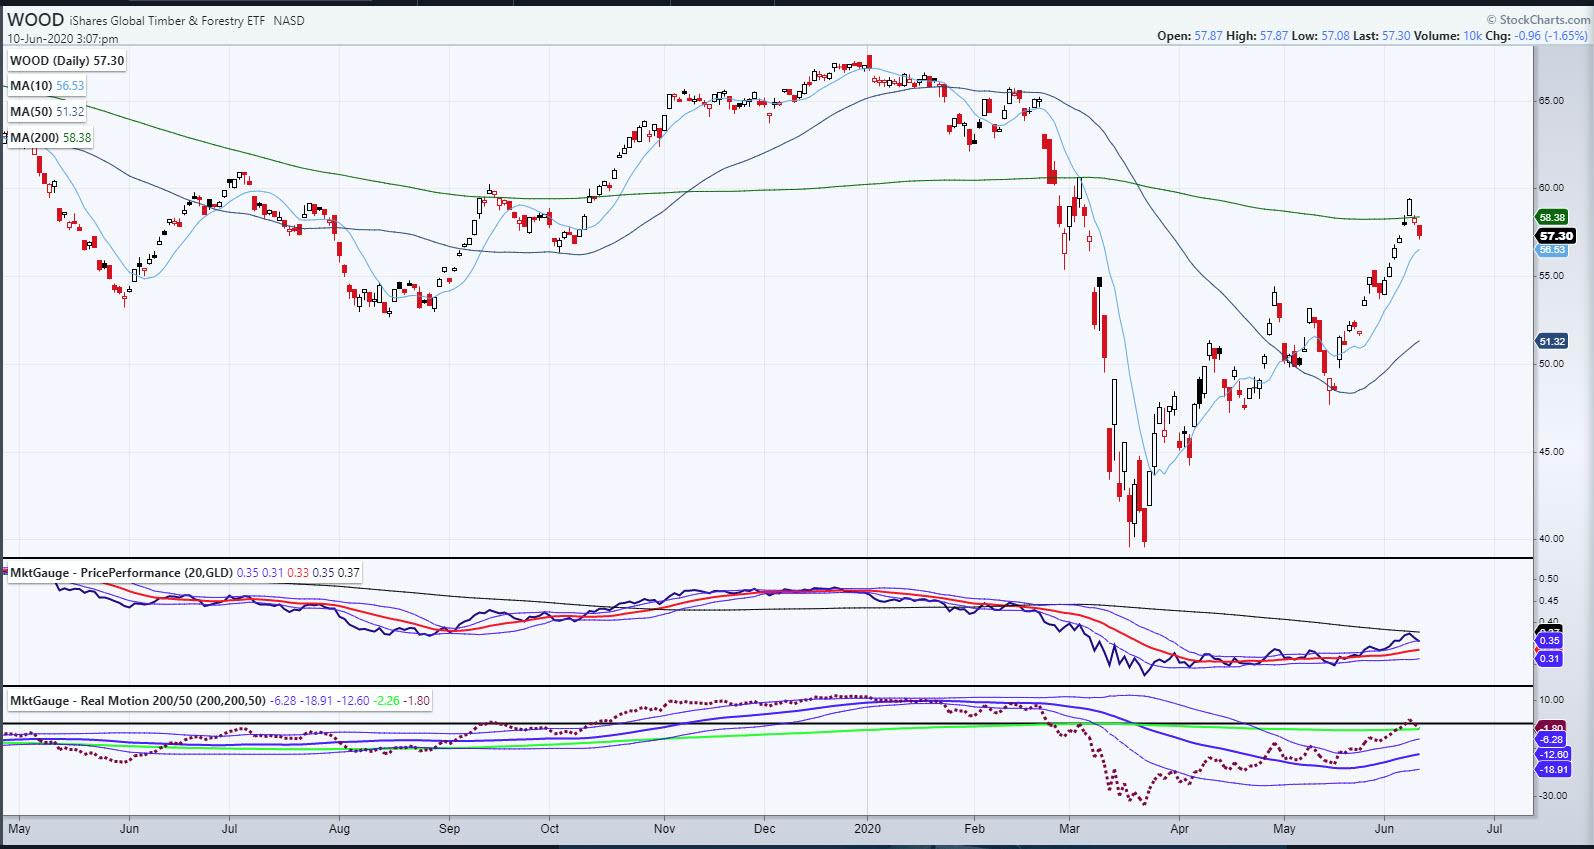
Why have I put up a chart on the wood to gold ratio? First off, WOOD vs. GLD - this ratio measures the relationship between gold (GLD) and lumber (WOOD). When this ratio is trending up, it indicates that the relative performance of lumber is improving versus gold. Lumber is a key input into construction, which tends to increase in strong or improving economic conditions. When the ratio is trending up and the distance between the ratio and the moving average widens, it serves as a good risk-on indicator.The current chart (courtesy of StockCharts) shows WOOD tried to clear the 200-daily moving average (green line) and could not confirm an improved phase change.
WOOD is approaching some short-term support at the 10-DMA (cyan line), so, if it holds around 56.55, that could help the overall chart pattern.
Regarding price performance, WOOD was outperforming gold, but failed to clear a 6-month moving average (black line). It has begun to underperform gold, which shows some concern with having too much risk on in equities, regardless of what the FAANG stocks and NASDAQ have done lately.
In fact, the Economic Modern Family (except for Semiconductors), Volatility Index and Treasury Bonds, support what the wood chart is showing. Gold shines, the economy has issues in spite of the Fed, and the sea change to stagflation (because of the Fed) grows stronger.
Two short interviews:
- Trader Rundown with Angela Miles BizFirstAM, 06-08-20: https://www.youtube.com/watch?v=9imEBlDIfCI&feature=youtu.be
- Wall Street Today, 06-09-20: https://www.meigutv.com/en/fed-will-stay-the-course/?from=singlemessage&isappinstalled=0#
- S&P 500 (SPY): 323 big resistance, 317 then 311.50 support
- Russell 2000 (IWM): Broke the 200-DMA. 147.50 pivotal
- Dow (DIA): 270 support resistance at 280.
- Nasdaq (QQQ): I'm tired just thinking about how tired this must feel
- KRE (Regional Banks): A reversal day confirmed. Needs to hold 40.00-41.00
- SMH (Semiconductors): 153 pivotal - also got to Bollinger band resistance on the monthly chart
- IYT (Transportation): 168 has to hold or will see 160 fast
- IBB (Biotechnology): 130-136 current range
- XRT (Retail): Reversal top confirmed; 42.90 some support, then 40.50 not crazy
- Volatility Index (VXX): 31.50 pivotal
Mish Schneider
MarketGauge.com
Director of Trading Research and Education


