Before we talk about the recent rotation from growth into value and how that did relative to the phases, a note about managing large selloffs.
A while back, we talked about market timing based on the previous day's high and low. Watching for breakouts and breakdowns based off of those price levels could help give short-term bias on the direction of the market.
Today, we saw a large market selloff as all four major indices closed red on the day. A choppy market is not fun to trade, but, with some market timing tools, we can quickly grasp if today was a day for us to buy, go short or just wait on the side for better opportunities.
Watching the highs and lows of the previous day are still very important, but today I want to add an indicator that gives us another layer of support and resistance levels to watch. That indicator, standard on all platforms, is Floor Trader Pivots (FTP).
Floor trader pivots use a calculation based on prior day's high, low and close that determine multiple support and resistance levels.
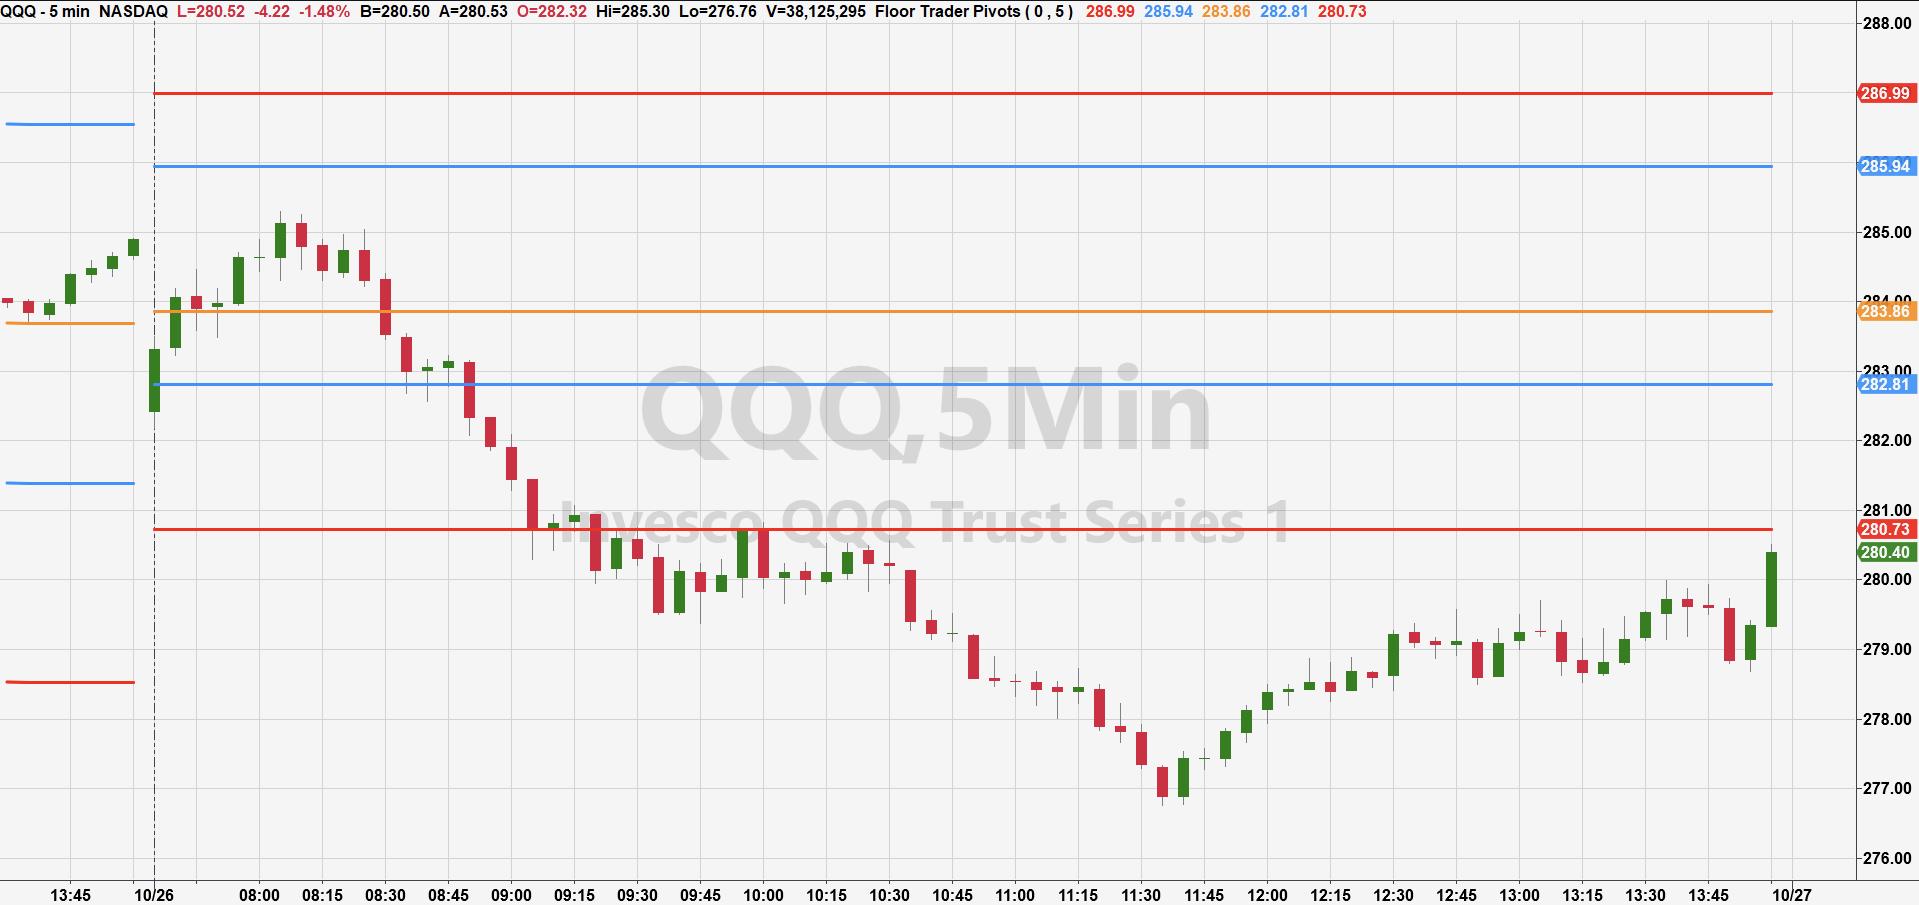
Above we have a 5-minute chart of the QQQs overlaid with the FTPs. Here are the pivot level names starting from the top of the chart to the bottom. I have also matched the colors to the pivot levels for clarity.
- Resistance 2 (R2) - Red
- Resistance 1 (R1) - Blue
- Pivot Point (PP) - Yellow
- Support 1 (S1) - Blue
- Support 2 (S2) - Red
The idea of using these levels is to watch how the price reacts to them and where it is trading compared to these levels. Ideally, when the price is over the PP level, you have a more bullish bias, whereas you have more of a cautious/bearish bias when the price is trading under the PP level. You are then watching to see if resistance or support pivot levels are broken.
In the chart above, you can see that we had a good start to the day running up past the PP level, but then sold off, breaking back under the PP level. This was the first sign to be more cautious, even though the QQQs were still trading over the day's opening price. When the day's open price was broken along with S1, this was a good sign that prices could go even lower.
Note how the market tried to hold S1 before breaking lower, then made the same pattern when breaking under S2.
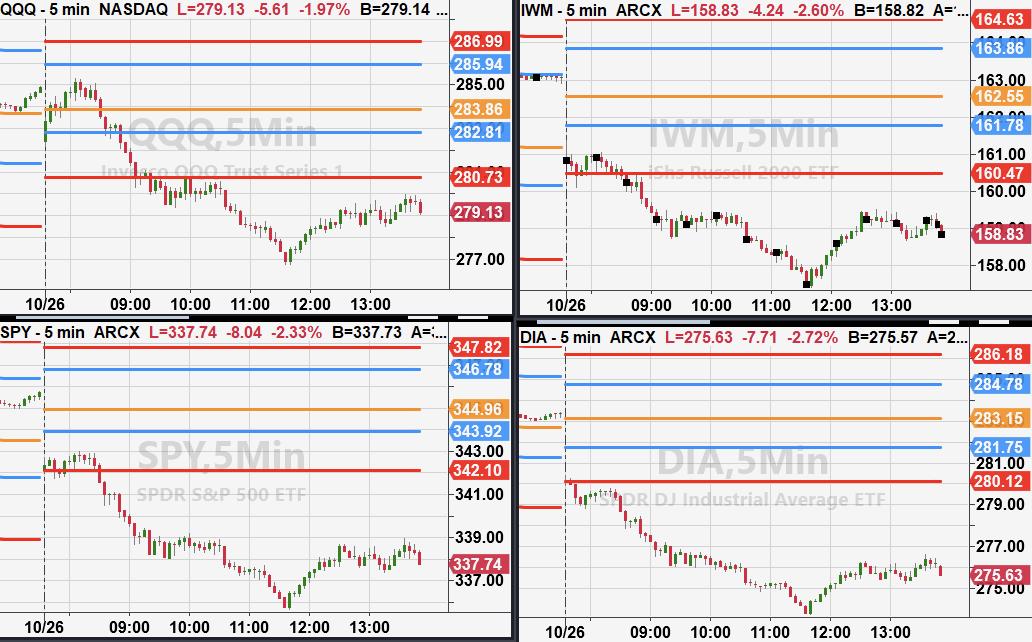
Above are 5-minute charts of the Nasdaq 100, the Russell 2000, the S&P 500, and the Dow Jones Industrial Average. The symbols represent their ETFs.
Now that you've become a bit more familiar with Floor Trader Pivots, let's look at the four major indices to get the bigger market picture. As you can see, IWM, SPY and DIA opened under S1, then broke under S2 shortly after. While using the FTPs isn't perfect, there are many great situations where you can watch specific levels to hold or break giving you a clear signal to enter or exit a trade.
Now, applying this to the indices for Tuesday, the SPY, DIA and QQQs all closed under their 50-DMA and into unconfirmed caution phases. The only one of the four indices that is still trading above the 50-DMA is the Russell 2000 IWM, or small caps.
As the one holdout in a bullish phase (SPY QQQ DIA in caution phases), as we look to the FTPs tomorrow, a move above the FTP, particularly if the move also holds above today's low, means we could see a turnaround Tuesday.
And, as the one that is not only in the best phase, but also saw recent institutional buying, small caps (IWM), over the pivots and prior day low, sets up as a low-risk buy opportunity, with a very clear risk should the pdl break down.
Any talk of an impending stimulus package could easily make Monday a one-day event, as we have seen so many times before. And now, with a low risk should the market continue lower, you can get out and perhaps think about a short trade instead.
- S&P 500 (SPY): 340 pivotal now as the 50-DMA as this is in an unconfirmed caution phase
- Russell 2000 (IWM): 155 best underlying support at the 50-DMA
- Dow (DIA): 280 the 50-DMA and now resistance to clear
- Nasdaq (QQQ): 280 pivotal resistance, with this in an unconfirmed caution phase
- KRE (Regional Banks): Confirmed accumulation phase Friday, so another one worth watching if market holds
- SMH (Semiconductors): 180 pivotal
- IYT (Transportation): 200 support, where the 50-DMA is
- IBB (Biotechnology): As expected, back in an unconfirmed caution phase
- XRT (Retail): 52 support, making this a sector to buy as well if market holds
Mish Schneider
MarketGauge.com
Director of Trading Research and Education
Forrest Crist-Ruiz
MarketGauge.com
Assistant Director of Trading Research and Education


