On Monday, the Economic Modern Family, which consists of 1 index and 5 key sectors, showed mixed signals as half of the Family closed down for the day. Currently, the Russell 2000 (IWM), Biotech (IBB) and Semiconductors (SMH) are down with Transportation (IYT), Retail (XRT) and Regional Banks (KRE) up on the day.
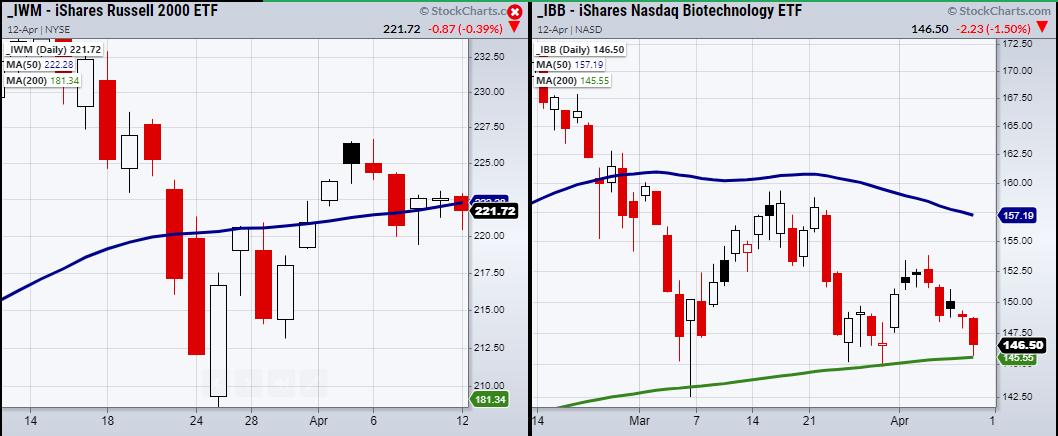
With SMH lingering in all-time high territory, IWM and IBB are the most worrisome of the bunch, as both sit near pivotal price levels made by their major moving averages. For IWM, the 50-Day moving average at $222.28 (Blue Line), while IBB, way weaker, sits above the 200-DMA at $145.55 (Green Line).
The key difference is their behavior around their moving averages. For example, if you look at IWM, you can see that it has broken through its 50-DMA four consecutive times in the last four trading days. IBB already broke its 50-DMA, but now has respected its moving average. Out of the four recent days it came close to breaking, it only broke once on March 5th. This shows that, if IBB breaks its 200-DMA and closes under, it will have much more meaning and could impact the IWM to finally break its 50-DMA.
Because IWM cannot be trusted to hold its moving average, we can look at the bigger picture, as the 50-DMA represents more of a price range to hold near, than a specific price level to put technical weight on. This means that, for Tuesday's trading session, if IWM decides to head lower, it will need to hold recent support of $219.39 from the April 8th, while IBB needs to hold over its 200-DMA at 144.55.
If IBB does break under its moving average and into a distribution phase, always watch for a second close under the moving average to confirm the phase change.
Watch Mish go through 10 symbols of key stocks reporting this week with actionable trading plans in the Monday, April 12th edition of Your Daily Five!
With dividends rising, stock buybacks returning and yields tightening, the banks are worth looking at for a few new long positions. In the latest edition of StockCharts TV's Mish's Market Minute, Mish looks at banks that offer commercial services in both FIAT, lending, and 24/7 liquidity.
ETF Summary
- S&P 500 (SPY): Made new highs.
- Russell 2000 (IWM): 219.39 support. Resistance 226.69
- Dow (DIA): 333.43 support
- Nasdaq (QQQ): 338.19 high to clear. Support 321.40
- KRE (Regional Banks): Needs to hold over 68.15
- SMH (Semiconductors): Bounced off the 10-DMA 250.07
- IYT (Transportation): New highs
- IBB (Biotechnology): 145.55 support
- XRT (Retail): Needs to clear 93, then 96.27
Mish Schneider
MarketGauge.com
Director of Trading Research and Education
Forrest Crist-Ruiz
MarketGauge.com
Assistant Director of Trading Research and Education


