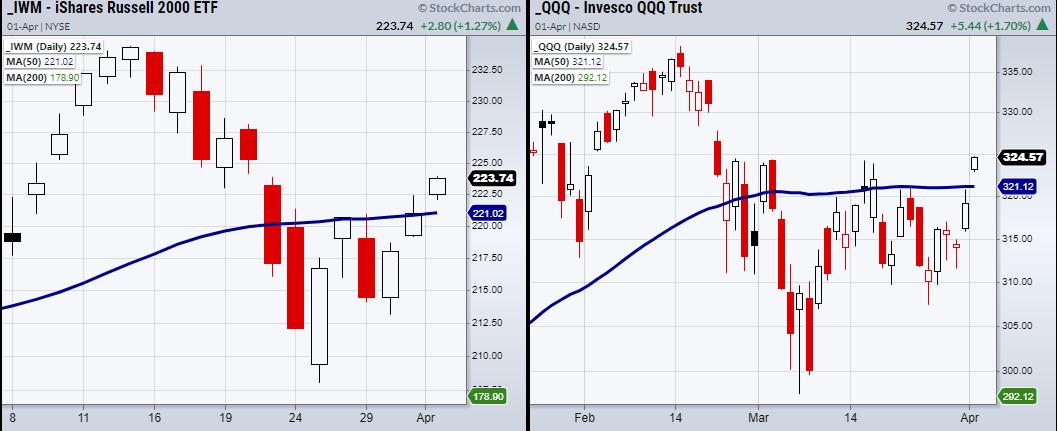
On Thursday, both the Russell 2000 (IWM) and the Nasdaq 100 (QQQ) cleared major resistance levels from the 50-day moving average. In many traders/investors' minds, this has opened the bullish floodgates with new highs in view. Additionally, the High Yield Bond ETF (JNK) is holding over its 50-DMA.
In the past, we have watched JNK as an indicator for investors' risk appetite in the market. JNK moving up/holding supports the market, as the Federal Reserve has been involved in buying bonds on a monthly basis, and it shows that investors are willing to take on risky debt.
However, even with these key resistance levels cleared in IWM and QQQ, we should be careful not to run into a common trading pitfall: Chasing!
Chasing securities is dangerous and can easily lead to losses if conditions turn against you. And frankly, the market has been very choppy. Therefore, asking yourself some quick questions before you place a trade could save you from some nasty price movements.
One question we always ask before making a trade is: "Where is our risk?" This will force you to pause and look at a chart in order to find a decent price level to risk to.
When choosing a risk level, here are two main points to keep in mind.
- Does my risk level have any meaning?
- Can I expect to make at least double my risk?
For instance, if we buy a stock for $10 and we risk $2 dollars, we expect the stock to move up $4 (double our risk) to at least $14.
Keeping these numbers in mind is important because, if we know how much we expect to make, then we can clearly see where the $14 price level is on the chart. This could show us that the stock needs to break considerably, which may often mean a breakout to new highs.
Also, when choosing a meaningful risk level, try to find a point on the chart that makes sense from a support point of view. Maybe you can find a recent low, a major moving average or a breakout level that offers support. You want to assess as reasonably as possible where the stock might fall to and how much you are willing to risk. So try to stay away from arbitrary stops or risk levels if you cannot find a suitable price point of support.
Often, when placing a trade, it can be hard to find a good risk level. If you cannot find a good price level, sometimes the best plan of action is to pass on the trade and look for a security that offers a better risk-to-reward ratio. There will always be another stock and money to be made when the risk and pattern set up right.
ETF Summary
- S&P 500 (SPY): New all-time highs
- Russell 2000 (IWM): Watching for a second close over 50-DMA at 221.02
- Dow (DIA): 332.86 high to clear
- Nasdaq (QQQ): Needs to confirm bullish phase change with second close over the 50-DMA at 321.12
- KRE (Regional Banks): Support 63.44 the 50-DMA. Like to see this clear over 67.97
- SMH (Semiconductors): 258.59 high to clear
- IYT (Transportation): Holding near highs
- IBB (Biotechnology): 145 support. Needs to hold over 150
- XRT (Retail): Another doji day
Forrest Crist-Ruiz
MarketGauge.com
Assistant Director of Trading Research and Education


