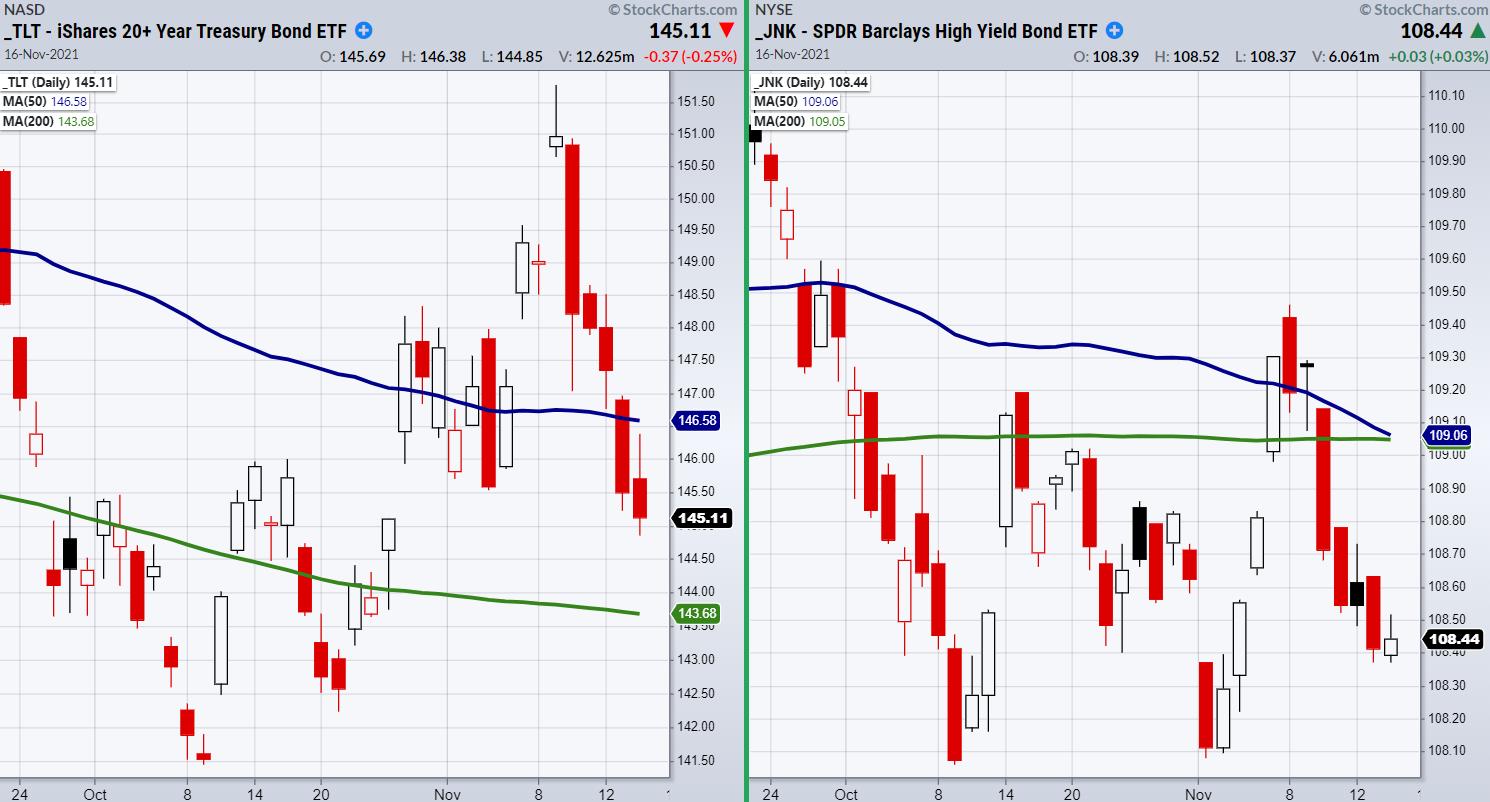
On Tuesday, the Long-Term Treasury Bond ETF (TLT) closed underneath its 50-day moving average for two consecutive days confirming a cautionary phase. TLT's trend has been relatively dormant for the past four months with multiple failed attempts to clear the $151.80 price area. However, this recent breakdown shows a risk-on scenario, as traditionally long-term bonds tend to move inverse to the general market. Additionally, if TLT breaks under its 200-DMA at $143.68, it will enter a distribution phase, giving more strength to the bullish picture.
On the other hand, although TLTs are looking weak, we like to pair long-term bonds with High Yield Corporate Bonds (JNK) for a more in-depth risk view. We watch JNK along with TLT because high-yield corporate debt is risky higher yielding debt. It helps show investor's appetite for risk compared to the less risky TLTs. Although TLT has broken under a major moving average, JNK should now rally back over the 10-day moving average at $108.78. However, if JNK breaks down any further, it has key support at $108.06. Therefore, if we are watching for the ideal bullish sign, it would show JNK rallying while TLT stays under its 50-DMA or breaks under its next major moving average.
Now that we have identified risk parameters involving JNK and TLT, we should watch for major indices to confirm the risk-on environment with prices pushing recent highs.
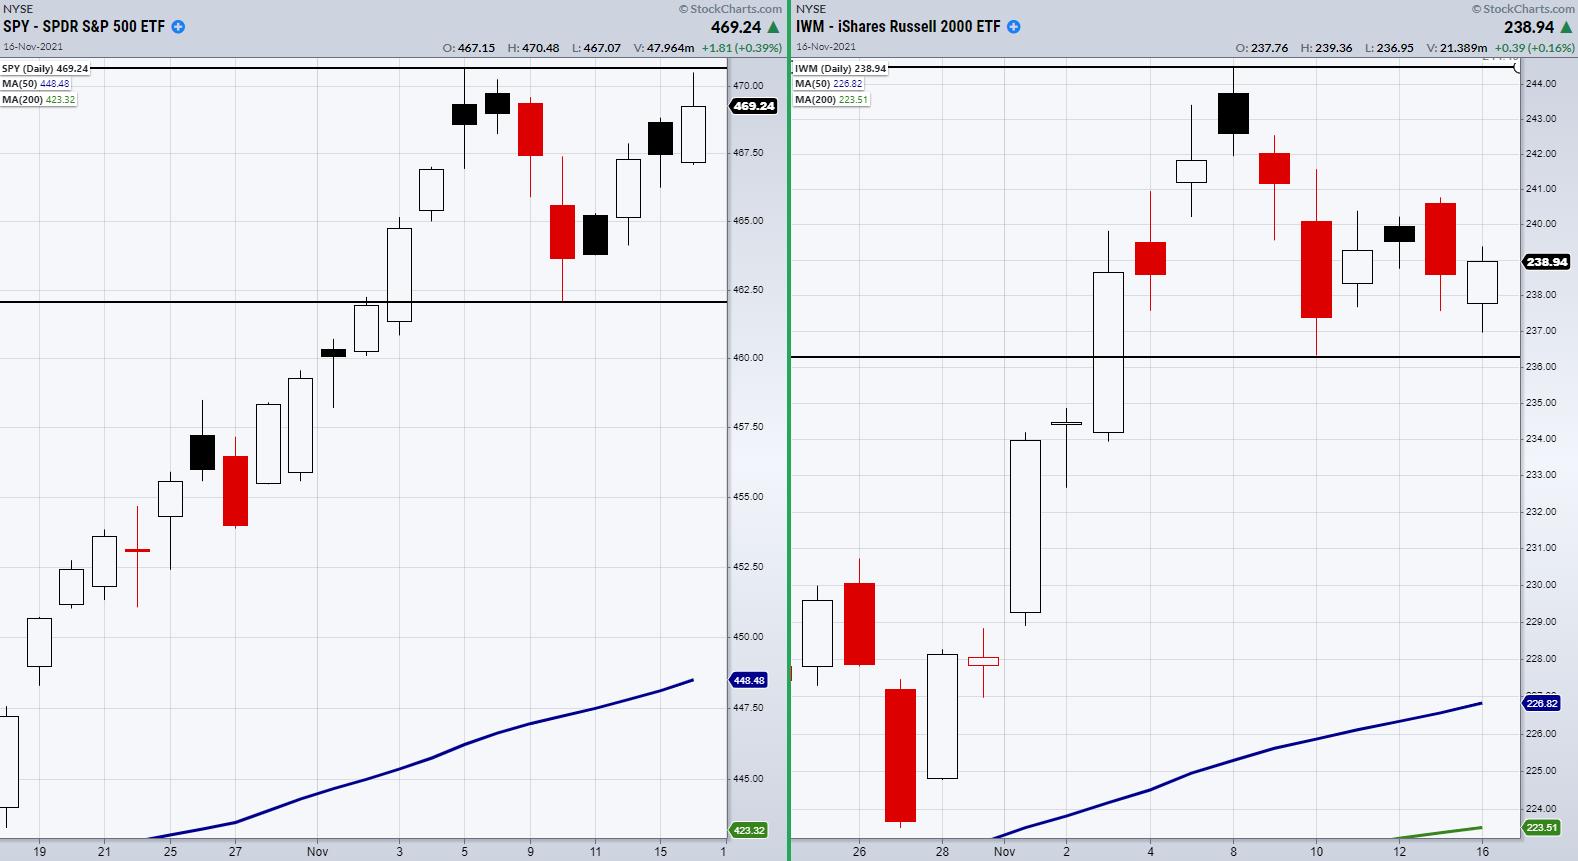
Looking at the above chart of S&P 500 (SPY) and the Small-Cap index Russell 2000 (IWM), we have clear levels of support and resistance. These will be our indicators for the coming week as we watch for a continuation of the bullish trend.
However, if TLT gathers strength and JNK breaks down any further, stay cautious.
Follow Mish on Twitter @marketminute for stock picks and more. Follow Mish on Instagram (mishschneider) for daily morning videos. To see updated media clips, click here.
Is it back to work or work from home? On the Monday, November 22 edition of Your Daily Five, Mish discusses the best way to look at this is the market in terms of price. You'll be surprised to see what she looks at, because it's going to show the opposite of what we hear the media talk about.
Watch Mish dive into the energy and oil sector on Bloomberg!
ETF Summary
- S&P 500 (SPY): 467.38 support. 470.65 high to clear.
- Russell 2000 (IWM): 236.31 support.
- Dow (DIA): 359.38 support. Flirting with the 10-DMA at 361.88.
- Nasdaq (QQQ): 387.53 support. 400.99 high to clear.
- KRE (Regional Banks): 75.59 high to clear and hold over.
- SMH (Semiconductors): 291.55 support. 305.95 to clear and hold over.
- IYT (Transportation): 275.11 minor support.
- IBB (Biotechnology): Holding general support area. Needs to get back over 154.48.
- XRT (Retail): 99.80 support.
Forrest Crist-Ruiz
MarketGauge.com
Assistant Director of Trading Research and Education
