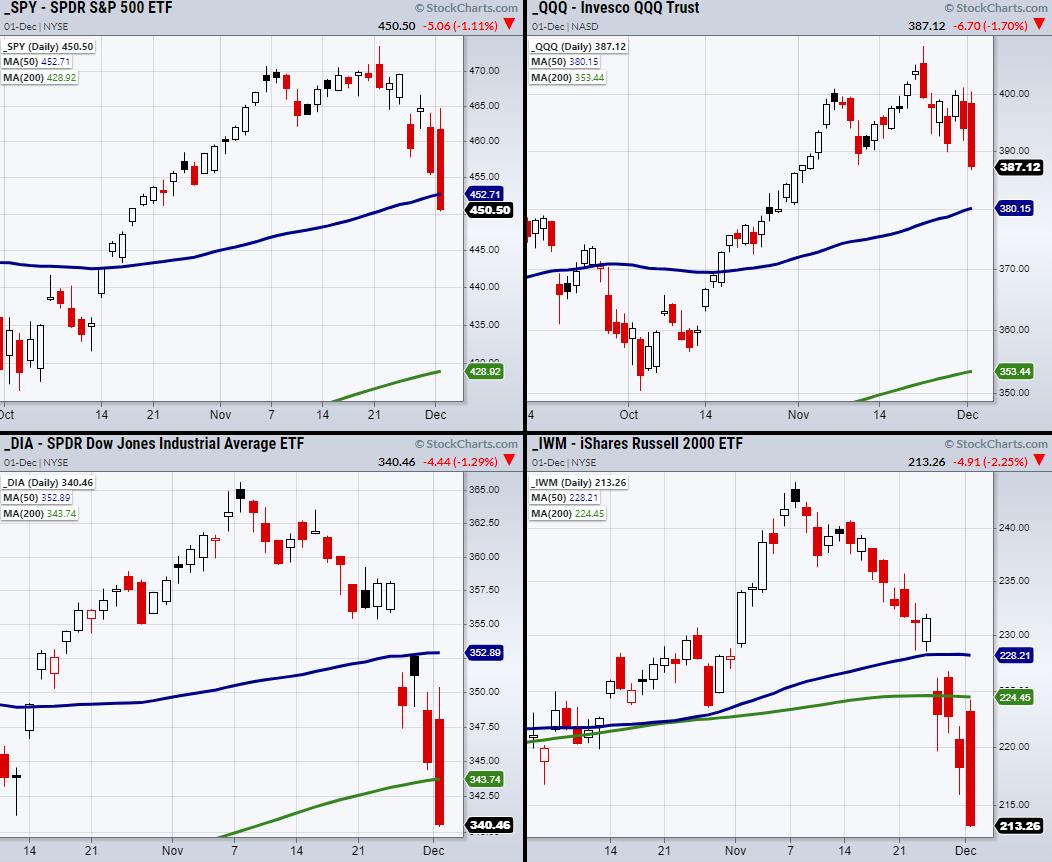
A distribution phase, as taught through Mish's book Plant Your Money Tree, is when the price of a symbol is trading underneath the 50- and 200-day moving averages while the 50-DMA is trading above the 200-DMA. This can be seen in the above chart of the Russell 2000 (IWM) and the Dow Jones (DIA). It points towards a bearish phase if it holds long enough.
Additionally, this phase change shows it's time for investors to become more cautious and watch for key turning points in the market's major indices. Currently, both the S&P 500 (SPY) and the Nasdaq 100 (QQQ) have yet to confirm a distribution phase. This shows a split between the indices, as the SPY and QQQ outperform the DIA and IWM.
However, if we were looking for phases to align with a distribution phase across all indices, it would take far too long, as the SPY and QQQ are far from their 200-DMA. Therefore, we need to watch pivotal points in SPY and the QQQ to hold or break down from here. This is very important as both the SPY and QQQ have the potential to stop the bleed for both the DIA and IWM.
When it comes to the QQQ, it will be pivotal if it can stay over $387. If not, the next area to watch is the $380 from the 50-DMA. Looking at the SPY, it will need to attempt a recovery back over its 50-DMA at 452.71. However, if both indices fail to reach or hold these levels, the DIA and IWM will have a lot more overhead pressure.
On the other hand, the DIA and IWM need to hold their current lows, which are already in support areas dating back through this year. If they can, the next step is for each to clear back over their 200-DMAs. Therefore, keep these price levels in mind; however, our main focus should be on the Nasdaq 100, as it carries the most strength and the best opportunity for turning the rest of the indices around.
Follow Mish on Twitter @marketminute for stock picks and more. Follow Mish on Instagram (mishschneider) for daily morning videos. To see updated media clips, click here.
Watch Mish's latest appearance on Making Money with Charles Payne!
ETF Summary
- S&P 500 (SPY): Needs to clear back over 452.71.
- Russell 2000 (IWM): Watching to hold current lows as support.
- Dow (DIA): Needs to clear back over 343.74 the 200-DMA.
- Nasdaq (QQQ): 387-384 area to hold.
- KRE (Regional Banks): 67.70 next support level from the 200-DMA.
- SMH (Semiconductors): 314 next resistance area. 297 minor support level.
- IYT (Transportation): Broke support from 200-DMA at 259.07.
- IBB (Biotechnology): Could easily test support at 150.21.
- XRT (Retail): 89 next support area.
Forrest Crist-Ruiz
MarketGauge.com
Assistant Director of Trading Research and Education
