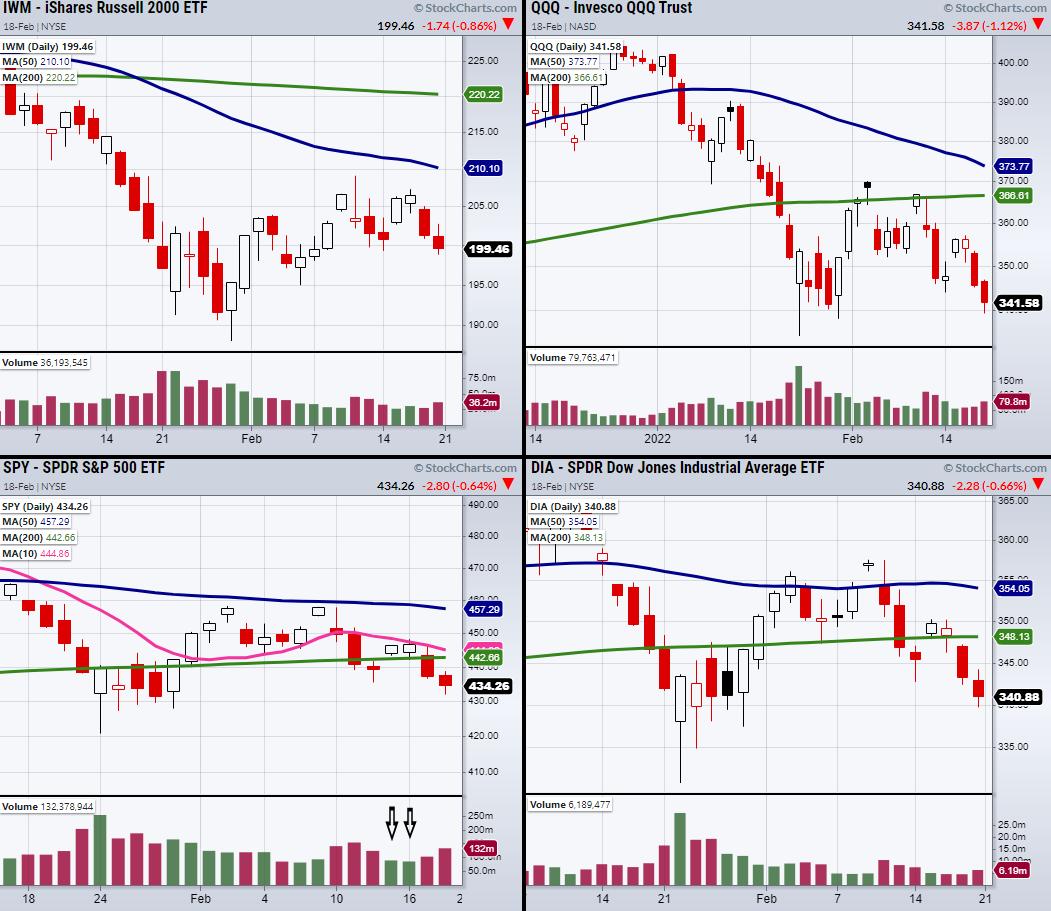
The Russell 2000 (IWM), S&P 500 (SPY), Dow Jones (DIA) and the Nasdaq 100 (QQQ) have all broken their previous minor support levels from Monday, February 14th's low as seen in the above chart. While the break under Monday's low makes the market look weak, the indices have only returned to price areas near the bottom of their current trading range.
Trading ranges have been a main focus this year, as stagflation paired with future rate hikes continues to add uncertainty into the market's future. Additionally, these range highs and lows have been important areas to watch for buying/shorting opportunities with quick risk-to-reward setups. With that said, let's take a closer look at the recent price action for short-term bullish or bearish signs in the upcoming trading week.
There are times when volume patterns can seem meaningless and sporadic; however, volume can often be useful in key areas. Currently all the major indices are showing similar volume patterns, so, for this example, we can zoom into the SPY chart to get a better look.
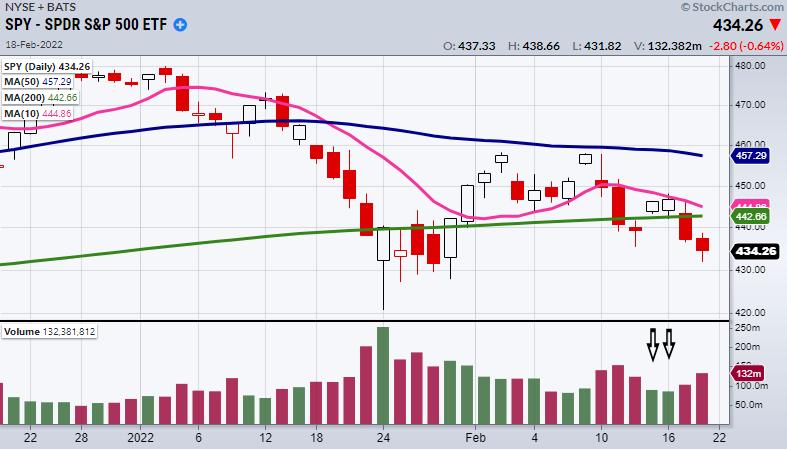
On rallies, it's a positive sign to see prices surge higher on above-average volume, while small pullbacks are made on lighter volume. This shows that interest is pushing to the upside while fewer profits are taken on the pullbacks. However, in the last 5 trading days in the SPY, we can see that, after Monday's dip lower, Tuesday and Wednesday (two arrows) are showing lower volume days on the rally higher. This shows a weak pushback towards the 10-day moving average, which the SPY was unable to clear.
Then, Thursday showed average volume on a large break lower. This is a good sign for bulls that a large amount of selling is not pushing the market lower. Though Friday's volume increased, the major indices held over main support from previous lows, dating back to late January. Therefore, as the indexes sit near support areas, we can watch for a reversal. However, we should careful when looking for trades to follow through if volume is light on upside moves.
While we still have much indecision in the indexes short-term charts, we are at least sitting in a pivotal area that can quickly show us if we are trading in the correct direction. With that said, if any large price moves are made watch for volume to back it up.
Follow Mish on Twitter @marketminute for stock picks and more. Follow Mish on Instagram (mishschneider) for daily morning videos. To see updated media clips, click here.
On this week's edition of StockCharts TV's Mish's Market Minute, Mish shows you where to park your money in this rangebound market. With ups and downs in current events, she still thinks there are plenty of opportunities for investing; you'll just need to get creative!
ETF Summary
- S&P 500 (SPY): Watching for a reversal near the bottom range around 430.
- Russell 2000 (IWM): 199 pivotal.
- Dow (DIA): 338 next support area.
- Nasdaq (QQQ): Sitting in support around 341.
- KRE (Regional Banks): Support 72.87 the 50-DMA.
- SMH (Semiconductors): 261.76 minor support.
- IYT (Transportation): Looks like a mess. Very choppy and can't seem to hold over the 50-DMA at 266.37.
- IBB (Biotechnology): 122.50 next support.
- XRT (Retail): Stuck in a range. 75.62 low of range.
Forrest Crist-Ruiz
MarketGauge.com
Assistant Director of Trading Research and Education


