The U.S stock market continues to display pressure from the Russian—Ukraine war.
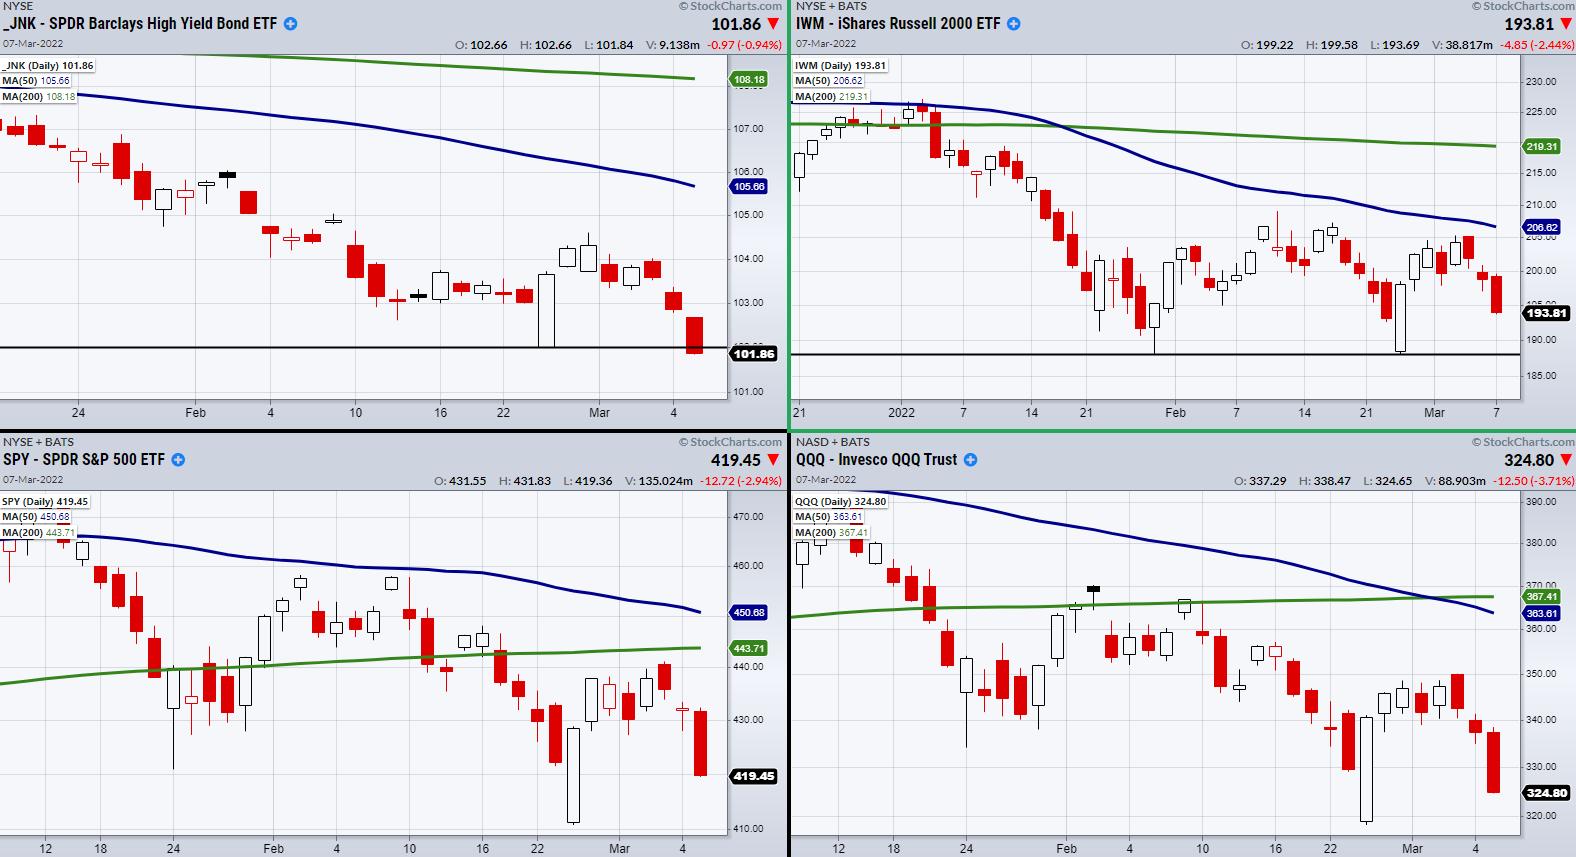
Additionally, High Yield Corporate Debt (JNK) broke support from its recent lows at $101.99.
Because we frequently use JNK as a risk on/off indicator, next we should watch for the major indices to break their recent lows.
This would confirm the market is following JNK.
As seen in the above chart, the Russell 2000 (IWM), S&P 500 (SPY), and the Nasdaq 100 (QQQ) are trading over their recent low from 3/7/2022.
Of the three, IWM has the strongest support level as it lines up with a prior low on 1/28.
While investors have already been buying safety plays such as precious metals, oil, and other commodities, we have yet to see if U.S treasury bonds make a meaningful push higher.
If the market is looking to break down further, we could see another wave in bond buying.
Currently, the 20+ Year Treasury bond ETF (TLT) is beginning to trend upwards, however, it has a lot of overhead resistance from the 50-Day moving average at $141.23, and the 200-Week MA at $140.91.
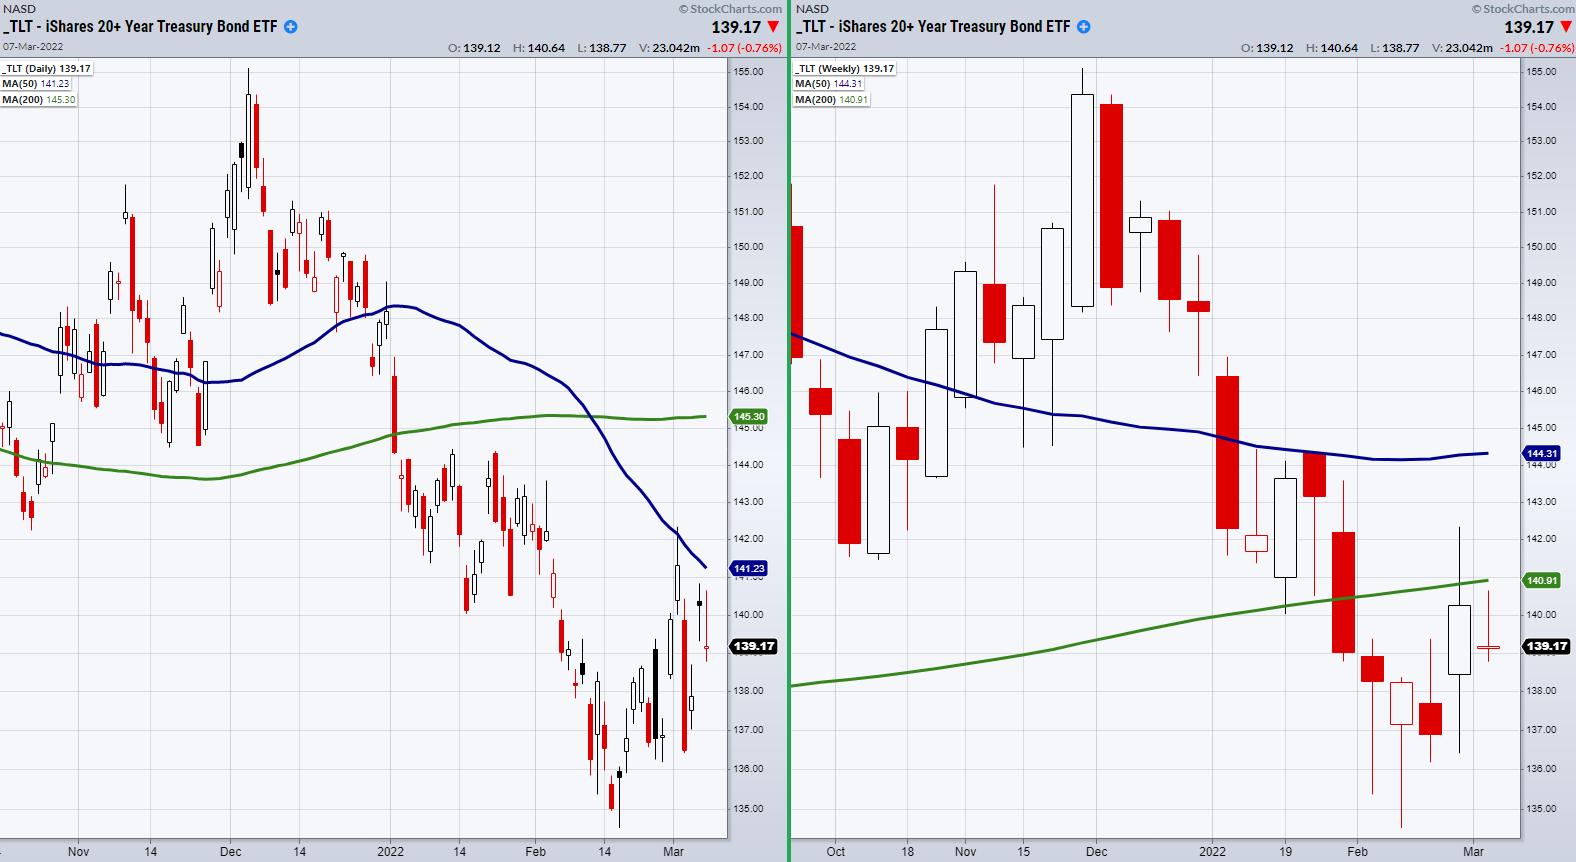
If TLT can hold this area and clear key MA resistance levels, we can watch for another move higher.
With that said, this type of trade should be timed with the overall market.
Therefore, watch for the indices to break their recent lows.
We do not want to get caught on the wrong side of the trade if the stock market holds key support.
Follow Mish on Twitter @marketminute for stock picks and more. Follow Mish on Instagram (mishschneider) for daily morning videos. To see updated media clips, click here.
On the latest edition of StockCharts TV's Mish's Market Minute, Mish takes you through four different signs of a bottom and shows you why it's very possible, despite ALL of the bad news, the market may be bottoming. She'll take a deep dive into the macro, showing you that, instead of listening to all the noise, the best place to go for your information is the charts.
ETF Summary
- S&P 500 (SPY): 410 support.
- Russell 2000 (IWM): 188 support.
- Dow (DIA): 322 support.
- Nasdaq (QQQ): 318 support.
- KRE (Regional Banks): 65.46 next support.
- SMH (Semiconductors): Broke support from 246.
- IYT (Transportation): 243-245 support area.
- IBB (Biotechnology): 118 support.
- XRT (Retail): 70 support.
Forrest Crist-Ruiz
MarketGauge.com
Assistant Director of Trading Research and Education


