Geopolitical stress from the Russia/Ukraine situation piles onto the market and the Fed, which is now faced not only with worries of the U.S inflation numbers, but also extra price surges in energy. Though the Fed has already scheduled rate increases through this year, the development and quick price surges could force the Fed to revise their increases.
Throughout the pandemic, the Fed has taken an accommodative stance at keeping money cheap. Their idea was that inflation would be transitory and peak before settling down. However, this has yet to happen, as the U.S inflation rate has been steadily increasing and is now around 7.5%. While this gives a snapshot view of what the market is dealing with, let's look into what the charts are telling us through technical analysis.
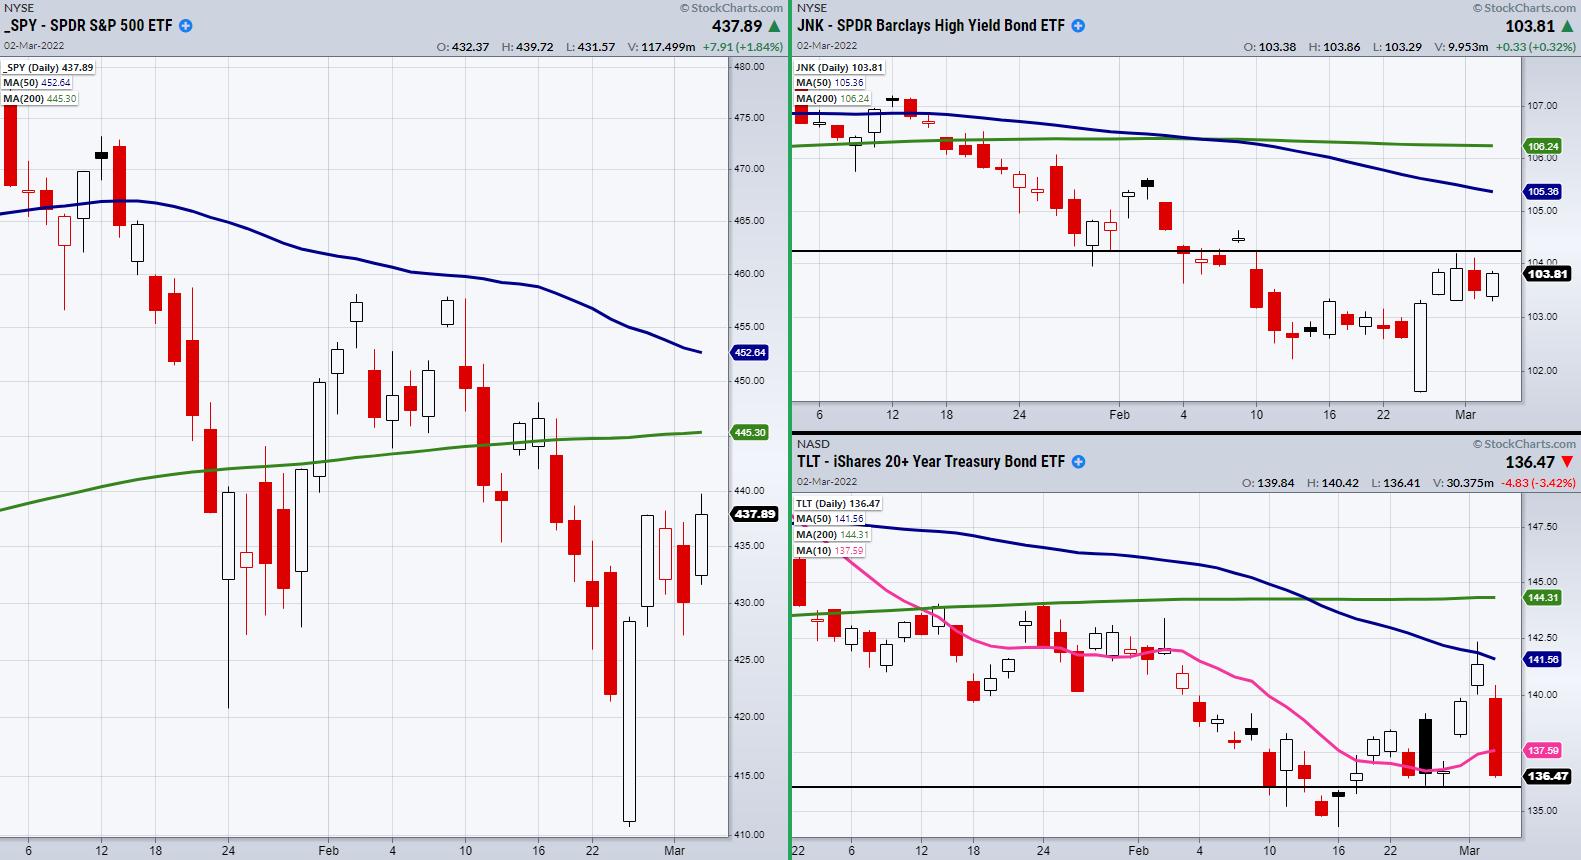
Above is a chart of the S&P 500 (SPY), High Yield Corporate Debt ETF (JNK) and 20+ Year treasury bond ETF (TLT). On Wednesday, the SPY made a strong close near the highs of the past three trading days. Because the SPY has held its price after last week's massive rally from the lows, we can look for a test of the next resistance area at $445 from the 200-day moving average.
Both JNK and TLT, in the short term, can support that the idea the market is still looking to hold its current price area. JNK, which shows investors' willingness to buy risky corporate debt, is a great risk on/off indicator. Teetering near the 10-day moving average at $103.55, JNK needs to clear over Monday's high of $104.60 to show that it's initiating a trend upwards.
On the other hand, after yesterday's test and failure of the 50-DMA, TLT has now broken under its 10-DMA at $137.73. However, TLT is now sitting in support from the prior week's low near $136.18. Breaking any lower shows that investors are not seeking the safety of the long-term treasury bonds and, therefore, can give the market another boost upwards. Though we are looking at obvious price levels to break or hold, we should also keep in mind that, if we are in a stagflationary environment, the market also can trend sideways and stay more rangebound.
Follow Mish on Twitter @marketminute for stock picks and more. Follow Mish on Instagram (mishschneider) for daily morning videos. To see updated media clips, click here.
Watch Mish's latest appearance on Bloomberg!
ETF Summary
- S&P 500 (SPY): 445.30 Next resistance.
- Russell 2000 (IWM): 208-209 resistance.
- Dow (DIA): Flirting with the 10-DMA at 338.62.
- Nasdaq (QQQ): 350 to clear.
- KRE (Regional Banks): Very choppy price action. Needs to clear and hold over 74.
- SMH (Semiconductors): 273 to clear.
- IYT (Transportation): Tested the 200-Day moving average at 261.84.
- IBB (Biotechnology): Flirting with the 10-DMA at 125.50.
- XRT (Retail): 75 support.
Forrest Crist-Ruiz
MarketGauge.com
Assistant Director of Trading Research and Education


