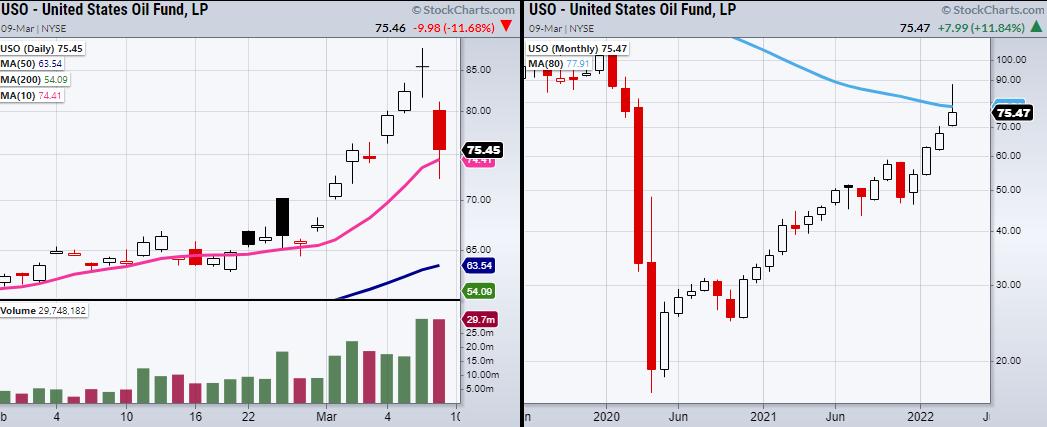
Oil is making a reversal pattern and rejecting its 80-month moving average; however, will the overall trend stay intact, or has Wednesday signified an end to the crazy oil rally?
Looking at the above chart of the United States Oil Fund (USO), we can see a large amount of volume on Tuesday and Wednesday. Both days have similar volume levels, with around 29 million shares traded. This shows that Tuesday's price move has been completely flipped not only in price but also in volume.
It's important to note because it makes the price move much more meaningful than if we had a breakdown on low volume. Compared to the 50-day volume average, which is around 8 million shares traded, watching the volume progress from here can tell us if large amounts of selling (backed by volume) continue through the week. If so, this will make Tuesday's high at $87.84 a much stronger resistance level to clear. Having said that, uncertainty about where/how the current administration will secure enough oil for the U.S means we could see even more volatility ahead.
From a daily technical side, the most obvious price level USO has closed over is the 10-day moving average at $74.41 (magenta line). If USO makes a close under the 10-DMA, it could easily breakdown further, as there are no obvious support levels nearby. If that is the case, waiting for USO to consolidate more is a good plan for anyone looking to buy.
So far, the oils price drop has helped the major indices out of the danger zone near their recent lows, dating back to 2/24. Specifically looking at the small-cap index Russell 2000 (IWM), we can see that, while a rally is encouraging, we have pushed right back into a very choppy zone.
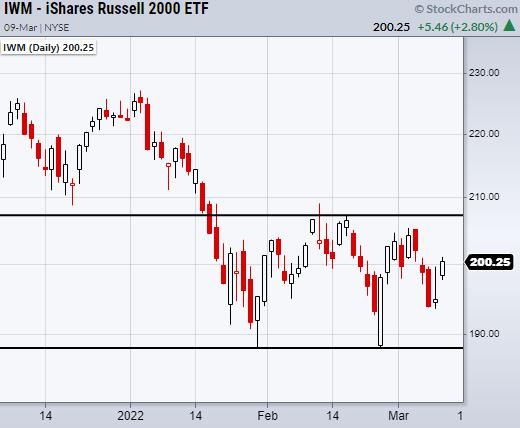
With IWM sitting at $200, it's only back in the middle of its range, as seen in the above chart. The bottom and top of its current range are shown with black lines.
While we can watch for trading opportunities in equities, we must be very careful when looking to place longer-term trades since IWM is stuck within its range. Nonetheless, if IWM continues upwards, watch for the high of the range to clear near $208.
Follow Mish on Twitter @marketminute for stock picks and more. Follow Mish on Instagram (mishschneider) for daily morning videos. To see updated media clips, click here.
On the March edition of StockCharts TV's The Pitch, Mish joins Mary Ellen McGonagle (MEM Investment Research) and Danielle Shay (Simpler Trading) as they each bring their five top stock ideas to the table and showcase the strategies they've used to select these promising trade targets. Erin Swenlin of DecisionPoint.com moderates as these seasoned technical analysts dive into the action and reveal the themes they are tracking, names they are following, and the charts they are watching to find strength in a time of heightened volatility for markets.
ETF Summary
- S&P 500 (SPY): 415 support.
- Russell 2000 (IWM): 193 support.
- Dow (DIA): 326 support.
- Nasdaq (QQQ): 318 support.
- KRE (Regional Banks): Needs to hold over 69 the 200-DMA.
- SMH (Semiconductors): 246 pivotal.
- IYT (Transportation): 243-245 support area. Resistance 273.
- IBB (Biotechnology): 118 support.
- XRT (Retail): 78 resistance.
Forrest Crist-Ruiz
MarketGauge.com
Assistant Director of Trading Research and Education


