Watch the 200-Week Moving Average on These 3 Symbols
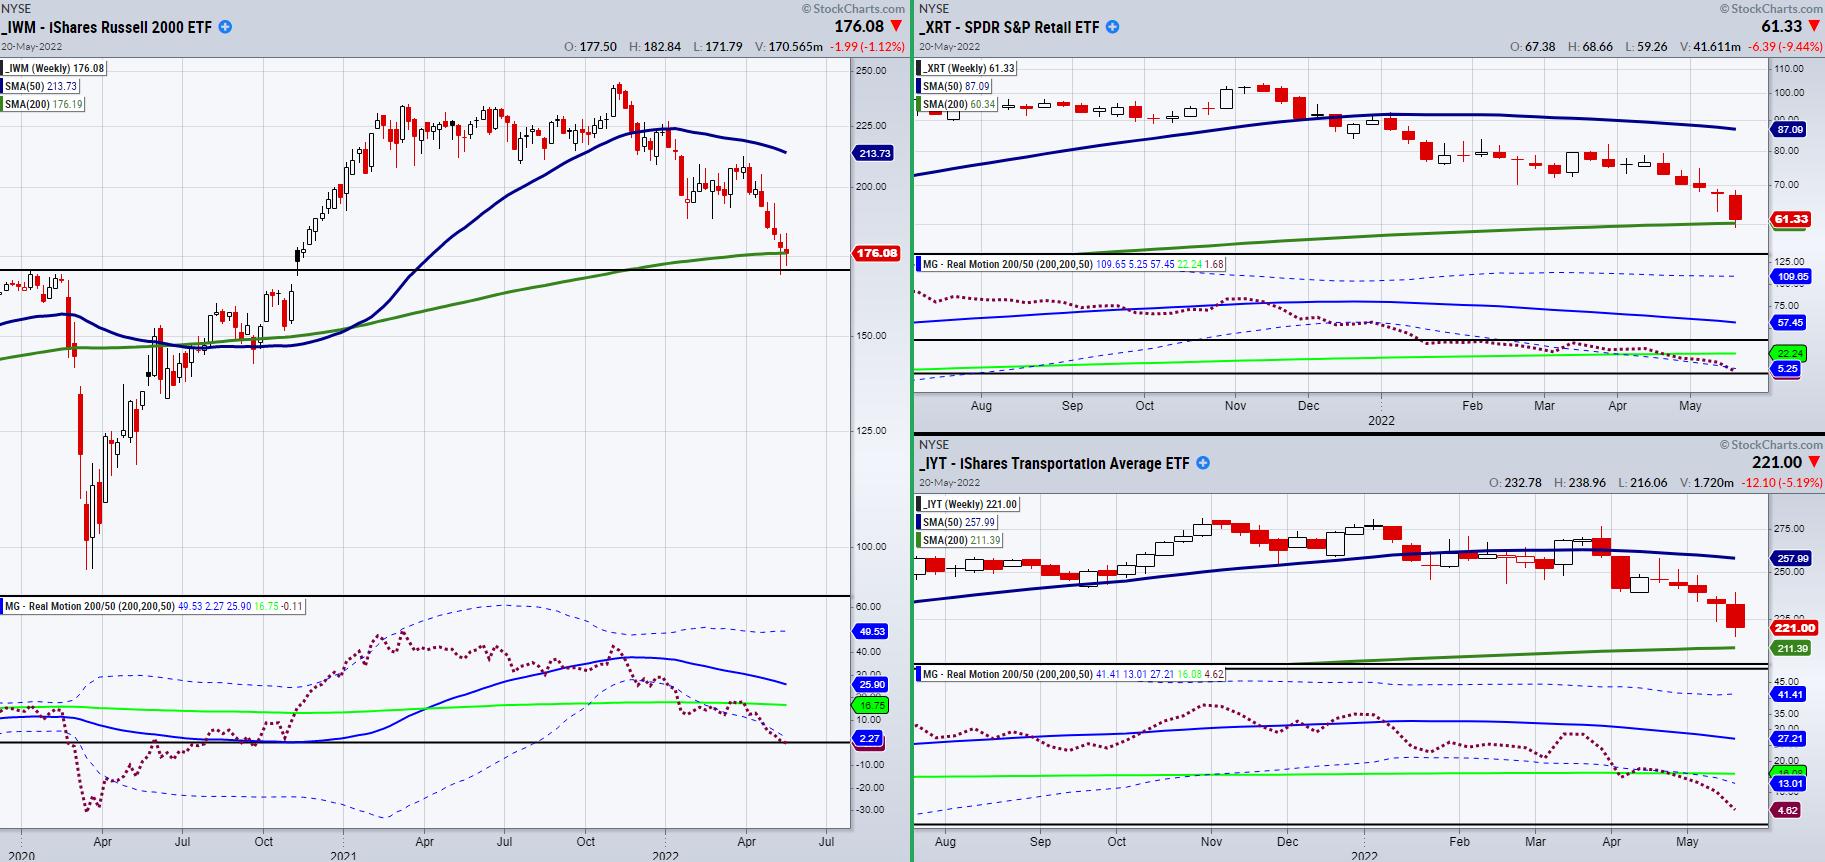
The small cap-index Russell 2000 (IWM) is hanging onto support from the 200-week moving average at $176.19. Last week, it dipped below the moving average with a low of $168.90. With that said, it looks as though IWM is trying to find temporary support in this price area between $168 and 176. If so, we should be careful of taking a full bearish stance through the coming week.
However, if we are going to look for a further breakdown, let's watch for confirmation not only from IWM, but two other important symbols. The two ETFs we are watching are the Retail (XRT) and Transportation (IYT) sectors. Together, they can give insight into investor's sentiment on basic supply and demand. This can also help us confirm a breakdown if both follow IWM lower.
Like IWM, each is currently holding over its 200-WMA. Additionally, from a momentum perspective, our RealMotion (RM) indicator found at the bottom of each chart is not showing any redeeming qualities, as each symbol is either on or has already broken the lower band. One thing to note is that, when RM is under the lower band, this shows the symbol is in oversold territory. However, a downward trending symbol can easily make quick fake out signals by briefly jumping over the dotted line. Therefore, if RM was going to show upside momentum, watch for the red dotted line to clear back over the lower band and begin to trend upwards.
Moreover, come Monday, if these symbols continue to hold over support from the 200-WMA, stay cautious of shorting the market as we could get a quick pop to the upside. While market weakness looks to continue from a fundamental standpoint, these pivotal areas in price can have a large amount of volatility which can easily shake short-term traders out of the market.
Follow Mish on Twitter @marketminute for stock picks and more. Follow Mish on Instagram (mishschneider) for daily morning videos. To see updated media clips, click here.
Read Mish's latest article on the Macro Picture on CMC Markets!
ETF Summary
- S&P 500 (SPY): 385 support area closed over.
- Russell 2000 (IWM): 168 area to watch for support. 183 resistance.
- Dow (DIA): Sitting at a pivotal price level.
- Nasdaq (QQQ): closed over support from285.
- KRE (Regional Banks): support 58.75.
- SMH (Semiconductors): 215 support. 239 resistance.
- IYT (Transportation): Needs to find support.
- IBB (Biotechnology): 116.68. to clear.
- XRT (Retail): 60.34 the 200-WMA.
Forrest Crist-Ruiz
MarketGauge.com
Assistant Director of Trading Research and Education