Pretty much everyone has turned into a bear. And no surprise, really. Personally, I think the bears are a bit late to the party. Nonetheless, the inflation concerns are real. The QT concerns are real. Yet the worries about recession, although real, may not necessarily come to pass as most feared.
As you may know, I am a huge fan of the Economic Modern Family. The EMF is made up of one index (Russell 2000) and five sectors (Retail, Transportation, Regional Banks, Semiconductors, Biotechnology), plus the newest member, Cryptocurrencies (Bitcoin).
Last week, the most dismal consumer confidence report showed historical lows. Also no surprise. However, the Retail sector of the EMF, whom I like to call Granny Retail, has exhibited some interesting positive relative performance. Whether it sustains or not remains to be seen. Clearly, the FOMC will have its say in the immediate future of the market and economy.
Why is Granny Retail so key?
With inflation on everyone's lips and the price of gas and food showing no signs of abating, the retail sector is the key to assess where the equity market goes from here.
The weekly chart of Retail XRT that we showed in yesterday's daily shows it is holding onto its weekly 200-MA at 60.62. Now, two things you should know. First, we are not talking our position, as we have virtually no equities in our holdings in the discretionary fund. (We do have a few in our quant models, but they are mainly energy-related.) Secondly, a weekly chart is only as good as its weekly close. And even with that, we generally look for confirmation the following week.
So, if XRT closes above 60.62, perhaps we got something to look at for next week. Otherwise, we most likely can count on another leg down.
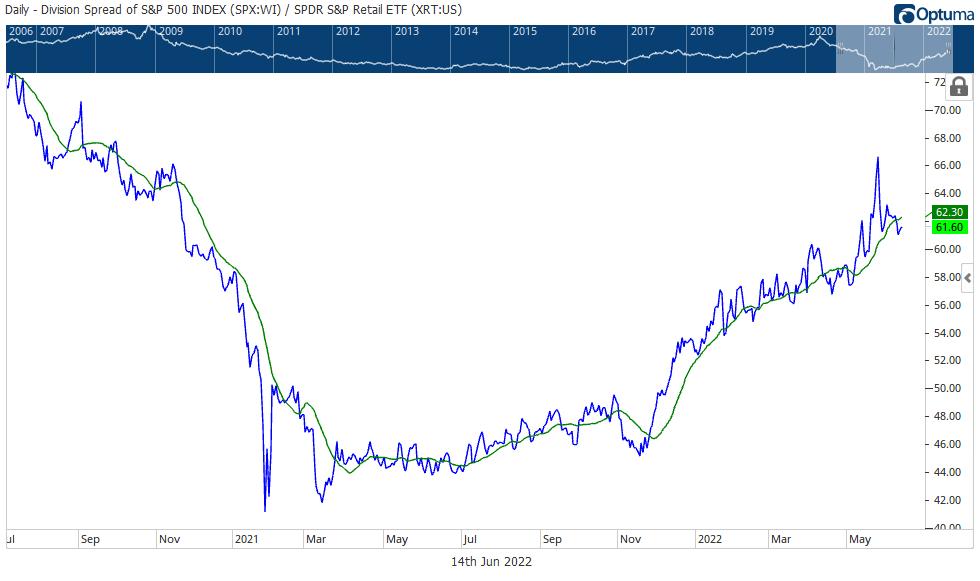
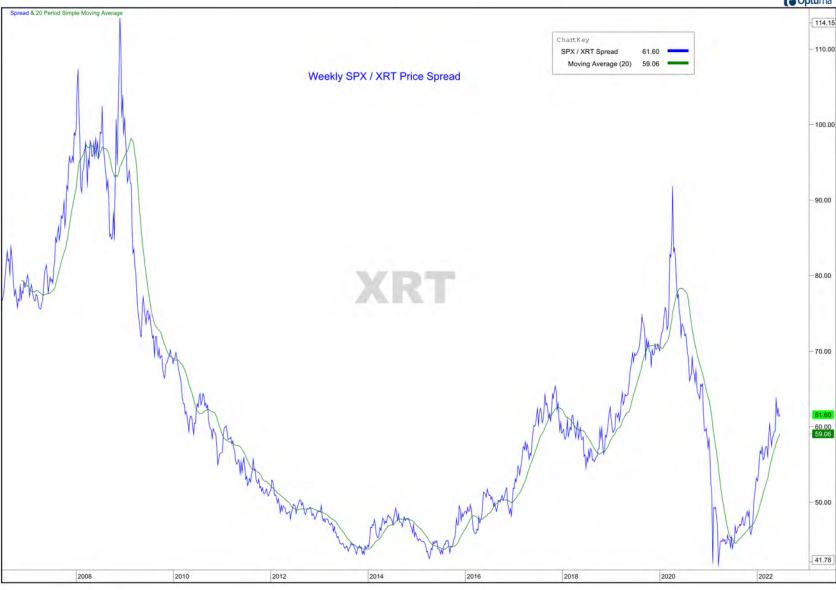
The chart we include shows the relationship between the retail sector and the S&P 500. The two charts show XRT, then XRT daily and weekly price spread to SPX, so the price spread depicts the ETF's relative performance compared to the S&P 500 (SPX/XRT). A rising price spread shows outperformance, while a declining price spread illustrates poor relative performance.
Currently, the daily chart shows how well XRT has outperformed until this past week, when the ratio has declined a bit. The weekly chart on the other hand, illustrates how, despite everything, XRT remains robust compared to the SPX.
Again, we have no skin in the game at this point. Should we see XRT hold up along with IYT, we will see that as a good sign and look at stocks like Nordstrom, Dollar Tree and GameStop. Otherwise, we will continue to play defense and hope a trading floor establishes itself soon.
Follow Mish on Twitter @marketminute for stock picks and more. Follow Mish on Instagram (mishschneider) for daily morning videos. To see updated media clips, click here.
Mish was a guest on the Tuesday, June 14th edition of StockCharts TV's The Final Bar with David Keller, where she talks looking for a bounce from the Retail ETF (XRT) and downside targets for Bitcoin.
See Mish on BizFirst AM discussing Bitcoin!
Mish also recently appeared on BNN Bloomberg, discussing the FOMC and what to trade.
Watch Mish cover her Economic Family on the Money Show!
Watch Mish's appearance on Bloomberg Markets, discussing what she sees going forward concerning inflation, recession, the Fed and the market.
Mish sit downs with Jared Blikre to discuss her history, investing and the future in this video from Yahoo Finance!

ETF Summary
- S&P 500 (SPY): 380 now pivotal resistance with 360 next support
- Russell 2000 (IWM): 168.90 May low, so will see if it can hold
- Dow (DIA): 306.28 May low pivotal support at 294
- Nasdaq (QQQ): 263 the 200-WMA with 280.21 resistance
- KRE (Regional Banks): 56 the 200-WMA
- SMH (Semiconductors): 195 some minor support with 220 resistance
- IYT (Transportation): 211.87 the 200-WMA to get back above
- IBB (Biotechnology): 105.39 pivotal area
- XRT (Retail): 60.62 the important 200-WMA support line
Mish Schneider
MarketGauge.com
Director of Trading Research and Education


