Some History First
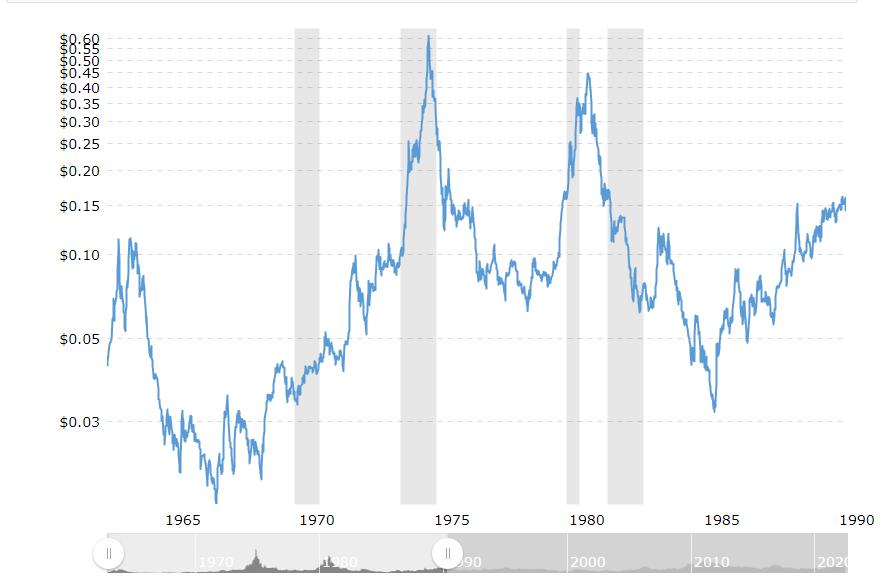
In 1972, supply shortfalls, rising demand, unrest in Pakistan and the devaluation of the dollar all contributed to a large increase in the price of sugar. By February of 1974, with rising inflation, rising demand from China, rumors of a large purchase by the USSR on global markets, large purchases by Arab nations, a bad European harvest and the perception of imminent shortages, sugar prices spiked to 20¢/lb., before sprinting to over 65¢ in November. Supply increases led to price declines thereafter, until another spike in 1980 due to crop shortfalls in Russia and Cuba. In October 1980, futures for March delivery reached over 45¢/lb. By 1982, prices fell back to under 6¢/lb.
Fast Forward to 2020. The price of sugar and its price pattern is based on many economic factors, trends, weather, government protectionist measures and supply/demand.
What can the past tell us about the future?
Today, the largest world producers of sugar are Brazil, India and China. As a global commodity, sugar is used in all types of foods, syrup and industrial uses, such as biofuel.
In the Philippines, retail prices of sugar have surged. However, in some countries, sugar crops are improving. India and Brazil expect increases in sugar yield because of favorable weather. Other Asian producers in the region are also benefiting from good weather. Nevertheless, the E.U. is expected to see a drop in the planted area next year.
Thailand suffered a major drought, which hurt its sugar production. Yet, like the U.S., their sugar consumption or demand is also increasing. And China, although a big producer of sugar, does not export much. With high tariffs, China is a net importer of sugar.
What does that tell us?
Supply, although now better than it was before the pandemic in India, Brazil and other parts of Asia, remains uncertain, because Mother Nature is unpredictable. Moreover, with any global social unrest like we saw in the early 1970s and even with slightly better supply, we could still see demand increase, especially with the theme of stagflation persisting. China can wind up buying more than they have as they continue to emerge from the pandemic.
Add to that, during hard times, folks turn to sugar. And the X factor--the dollar--with any major decline (which is entirely possible), we could see sugar prices repeat not only the 2021 highs, but possibly higher.
We Turn to the Charts
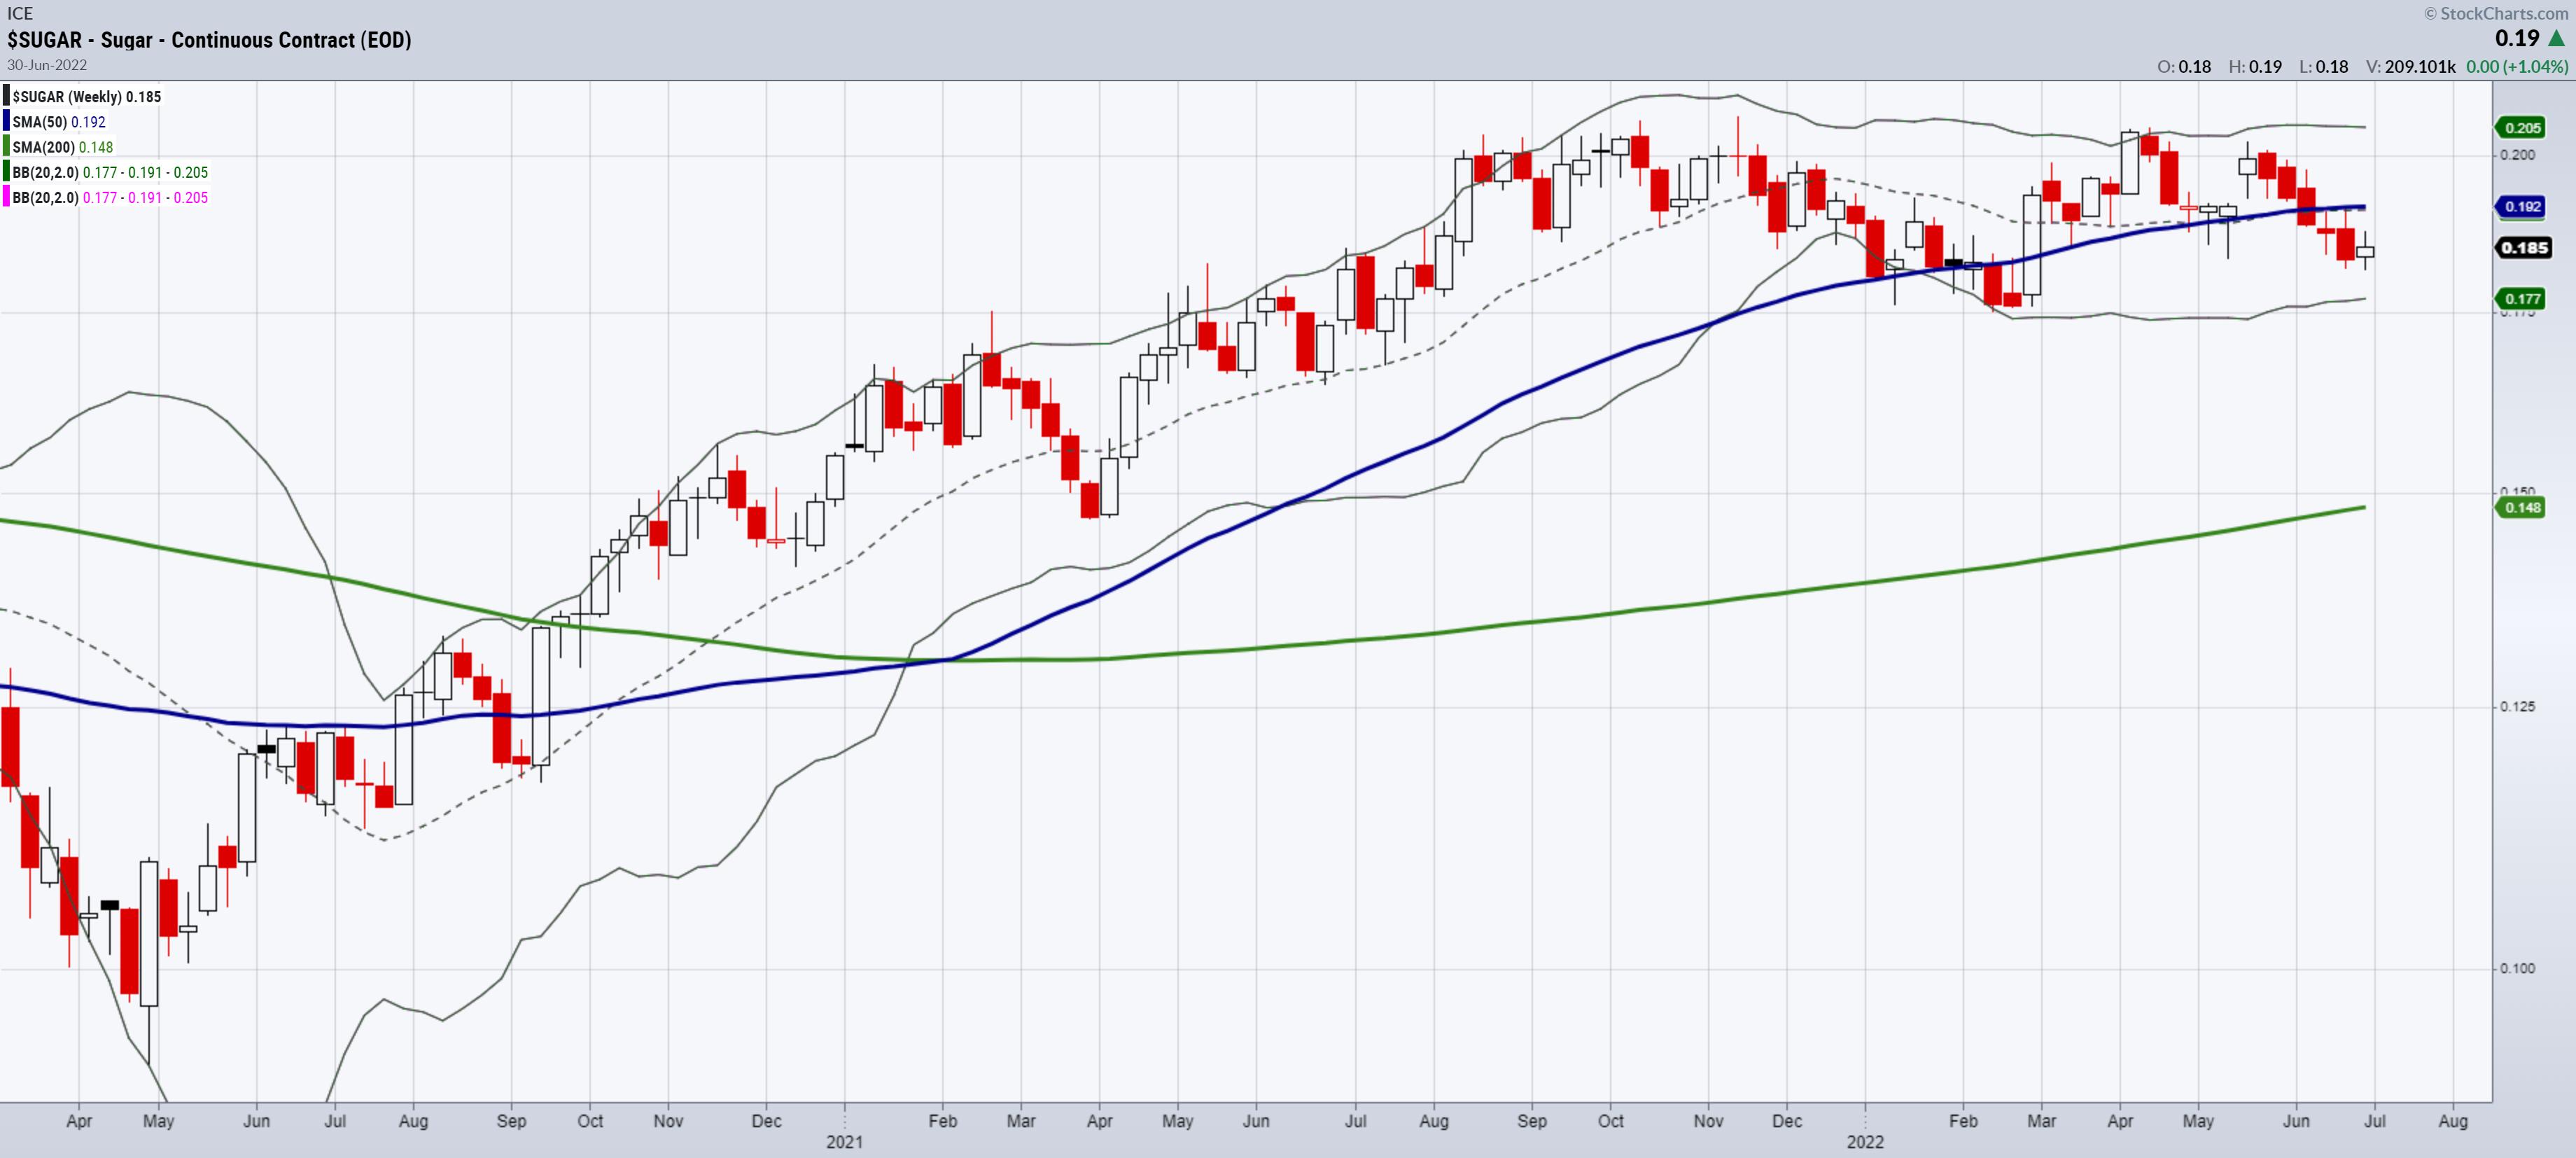
The chart of the price in 2020 at its lowest was 9¢/lb. By the fall of 2021, the price peaked to 21¢/lb., or more than double. To date, sugar has settled at around 18¢/lb., down from the peak but still double the low from 2020.
If sugar falls below 18¢/lb., then perhaps the inflation narrative really does begin to change. But sugar has barely declined compared to say, wheat, which has fallen 31% from its peak. That suggests we should continue to watch sugar for clues. Could we see a 1979-type of second explosion in commodity prices?
This is where we have big eyes.
 Get your copy of Plant Your Money Tree: A Guide to Growing Your Wealth and a special bonus here.
Follow Mish on Twitter @marketminute for stock picks and more. Follow Mish on Instagram (mishschneider) for daily morning videos. To see updated media clips, click here.
Mish in the Media
See Mish's latest appearance on BNN Bloomberg!
Read Mish's latest article for CMC Markets, where she takes a big-picture view of the US's current economic circumstances!
ETF Summary
- S&P 500 (SPY): 380 pivotal, 385 resistance, 370 support
- Russell 2000 (IWM): 170 pivotal, 175 next resistance
- Dow (DIA): 307 support; needs to clear 315
- Nasdaq (QQQ): 273 support, with 284 point to clear
- KRE (Regional Banks): 56 the 200-WMA; 60 resistance
- SMH (Semiconductors): Made a new 2022 low entering oversold territory
- IYT (Transportation): 211.90 support with 220 next resistance.
- IBB (Biotechnology): Needs to get over 121 to continue up
- XRT (Retail): Inside day making it super important to watch the range break and follow 59.24-57.35
Mish Schneider
MarketGauge.com
Director of Trading Research and Education


